Summary
Rev Bras Ginecol Obstet. 2024;46:e-rbgo9
To analyze the amount of muscle and the presence of sarcopenia in postmenopausal women using different methods, verifying the agreement between them as to skeletal muscle mass (SMM).
This cross-sectional observational study was conducted with postmenopausal women aged ≥ 50 years. SMM was obtained from a predictive equation, Bioelectrical Impedance (BIA), and Dual Energy X-Ray Absorptiometry (DXA). The skeletal muscle mass index (SMI) and the appendicular skeletal muscle mass index (ASMI) were calculated. The cut-off point of SMI was determined for the population itself. The agreement between the SMI obtained using the different methods was verified. Sarcopenia was diagnosed according to the criteria proposed by the European Working Group on Sarcopenia in Older People 2 (EWGSOP2). The significance level adopted for all tests was 5.0%.
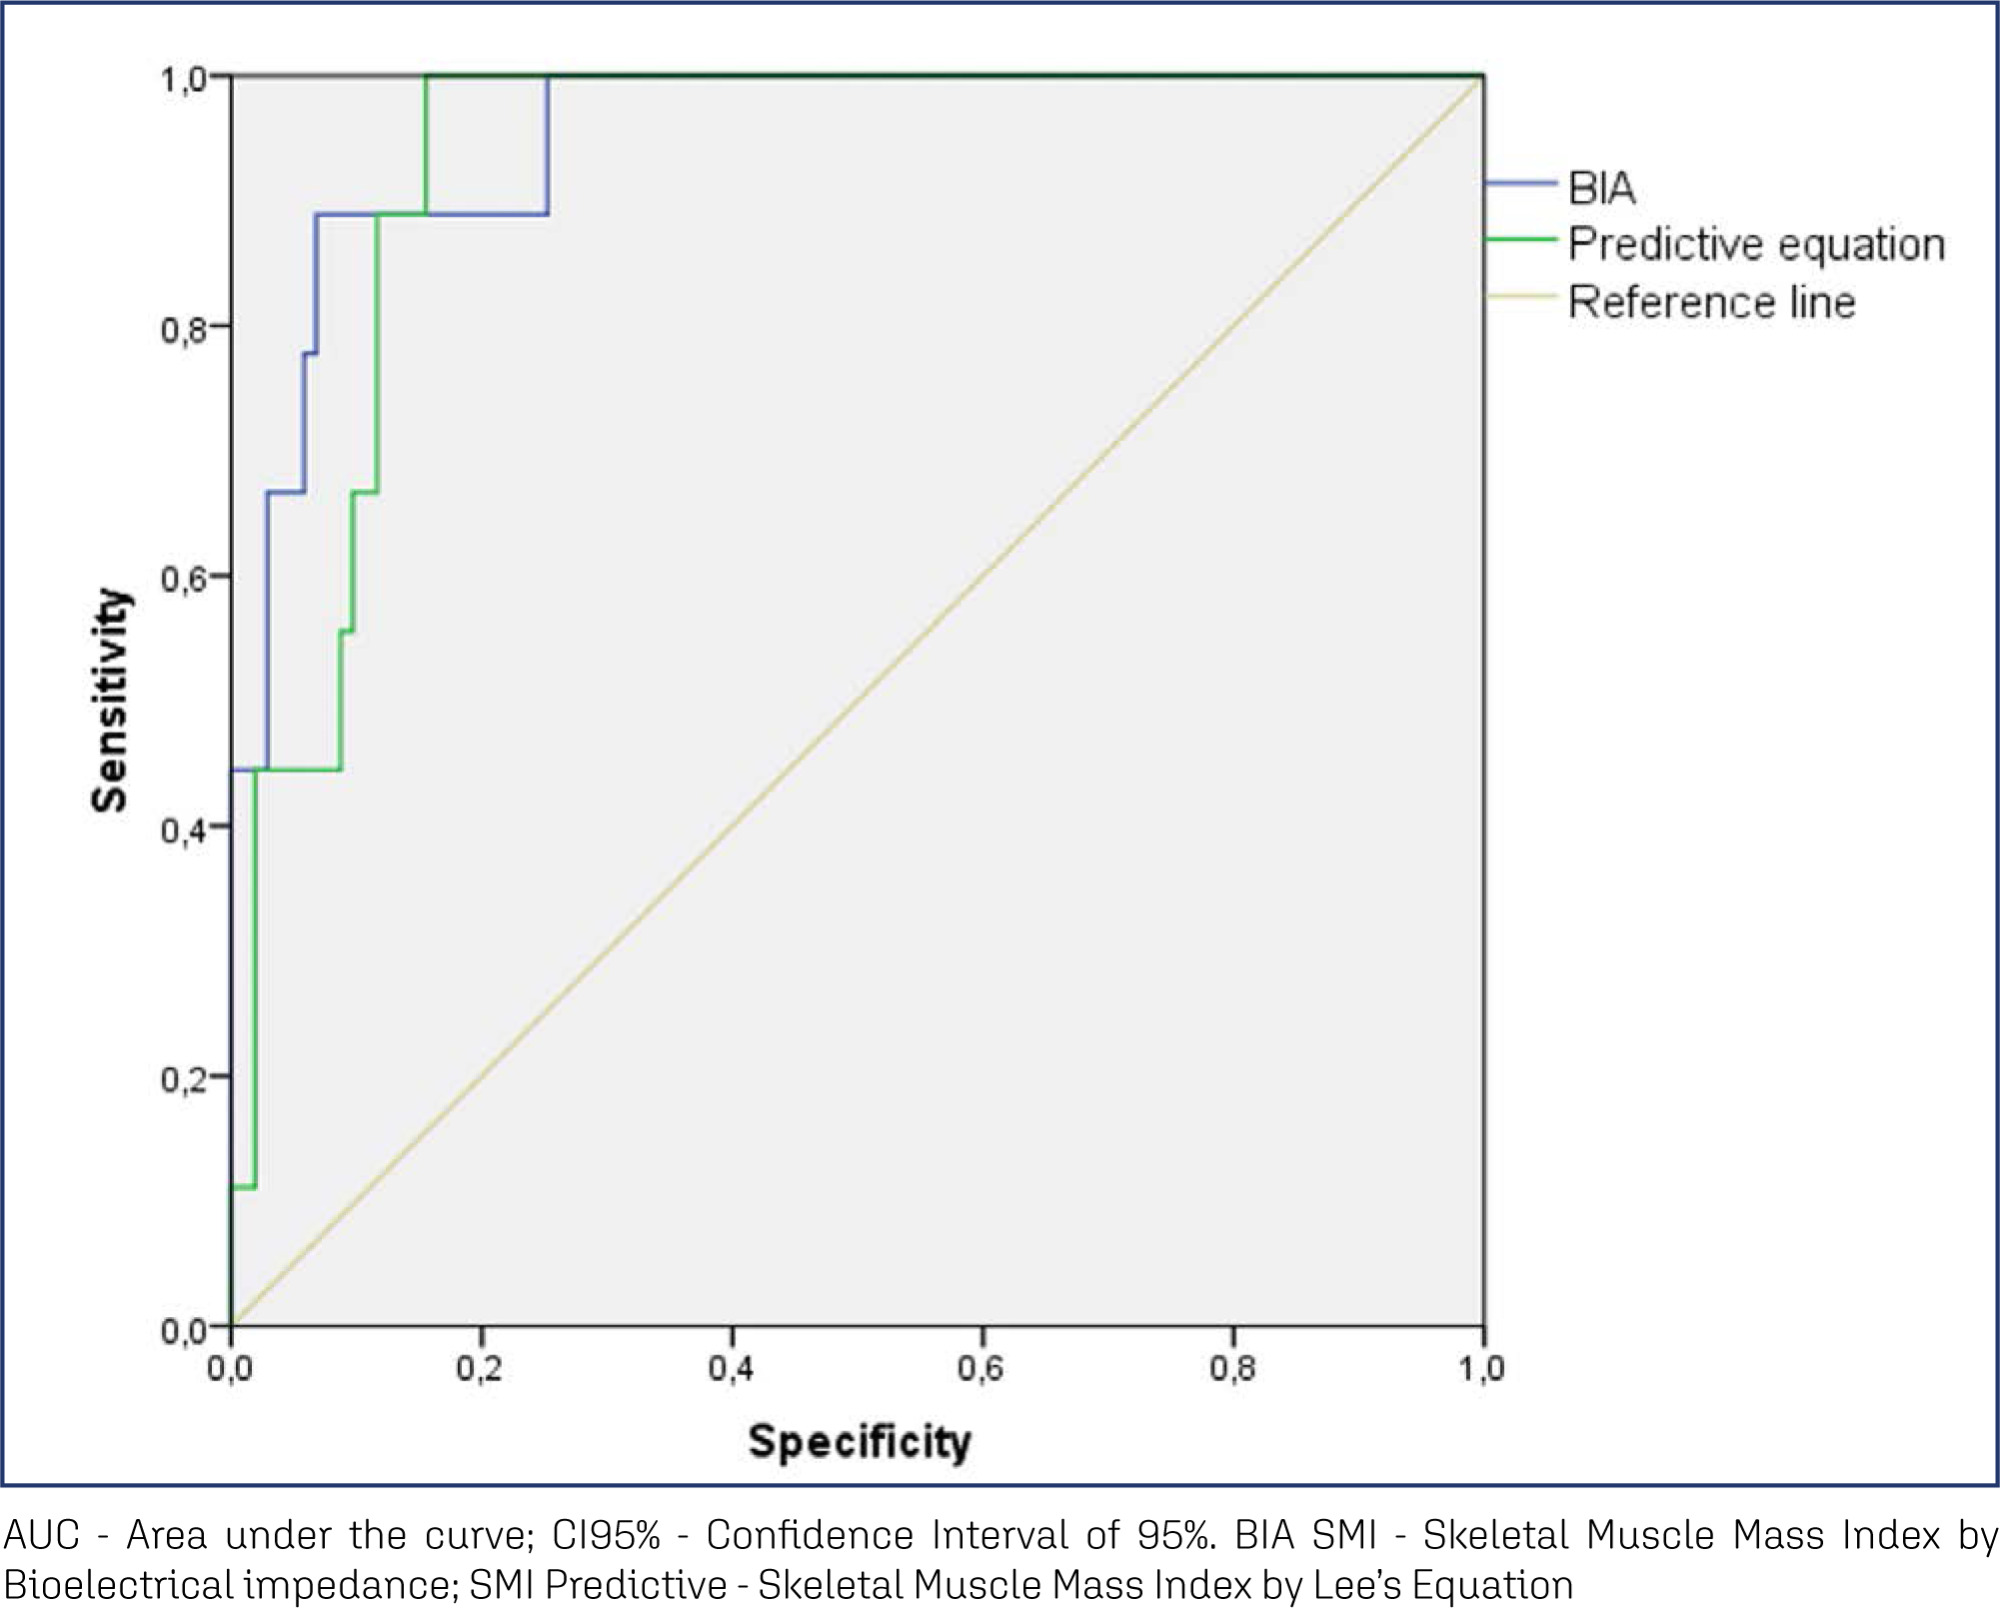
A total of 112 women were evaluated, with an average age of 66.1 ± 5.65 years. Among them, 51.8% were sufficiently active and 43.8% were overweight and obese. The SMI cut-offs were 6.46 kg/m2 for the predictive equation and 7.66 kg/m2 for BIA, with high sensitivity and specificity. There was an excellent agreement in the identification of SMM by the predictive equation (0.89 [0.824-0.917], p < 0.001) and BIA (0.92 [0.883-0.945], p < 0.001), in reference to DXA. The prevalence of sarcopenia was 0.9%, 1.8%, and 2.7% according to BIA, DXA, and the predictive equation, respectively.
The predictive equation showed the expected agreement in estimating skeletal muscle mass in postmenopausal women, offering a viable and accurate alternative.
Summary
Rev Bras Ginecol Obstet. 2024;46:e-rbgo9
To analyze the amount of muscle and the presence of sarcopenia in postmenopausal women using different methods, verifying the agreement between them as to skeletal muscle mass (SMM).
This cross-sectional observational study was conducted with postmenopausal women aged ≥ 50 years. SMM was obtained from a predictive equation, Bioelectrical Impedance (BIA), and Dual Energy X-Ray Absorptiometry (DXA). The skeletal muscle mass index (SMI) and the appendicular skeletal muscle mass index (ASMI) were calculated. The cut-off point of SMI was determined for the population itself. The agreement between the SMI obtained using the different methods was verified. Sarcopenia was diagnosed according to the criteria proposed by the European Working Group on Sarcopenia in Older People 2 (EWGSOP2). The significance level adopted for all tests was 5.0%.
A total of 112 women were evaluated, with an average age of 66.1 ± 5.65 years. Among them, 51.8% were sufficiently active and 43.8% were overweight and obese. The SMI cut-offs were 6.46 kg/m2 for the predictive equation and 7.66 kg/m2 for BIA, with high sensitivity and specificity. There was an excellent agreement in the identification of SMM by the predictive equation (0.89 [0.824-0.917], p < 0.001) and BIA (0.92 [0.883-0.945], p < 0.001), in reference to DXA. The prevalence of sarcopenia was 0.9%, 1.8%, and 2.7% according to BIA, DXA, and the predictive equation, respectively.
The predictive equation showed the expected agreement in estimating skeletal muscle mass in postmenopausal women, offering a viable and accurate alternative.
Summary
Rev Bras Ginecol Obstet. 2020;42(12):811-819
The present study aimed to investigate the physical performance of handgrip strength (HGS) in women with polycystic ovary syndrome (PCOS).
A case-control study that included 70 women with PCOS and 93 agematched healthy women aged between 18 and 47 years with body mass index (BMI) between 18 Kg/m2-39.9 Kg/m2. The serum levels of total testosterone, androstenedione, insulin, estradiol, thyroid-stimulating hormone (TSH), prolactin, sex hormonebinding globulin (SHBG), and 17-hydroxyprogesterone (17-OHP) were measured. The free androgen index (FAI) and the homeostatic model assessment of insulin resistance (HOMA-IR) were calculated. The body composition regions of interest (ROIs) were assessed by dual-energy X-ray absorptiometry (DXA), and the handgrip strength (HGS) was evaluated for both the dominant and the non-dominant hands with a manual Sammons Preston (Bolingbrook, IL, US) bulb dynamometer.
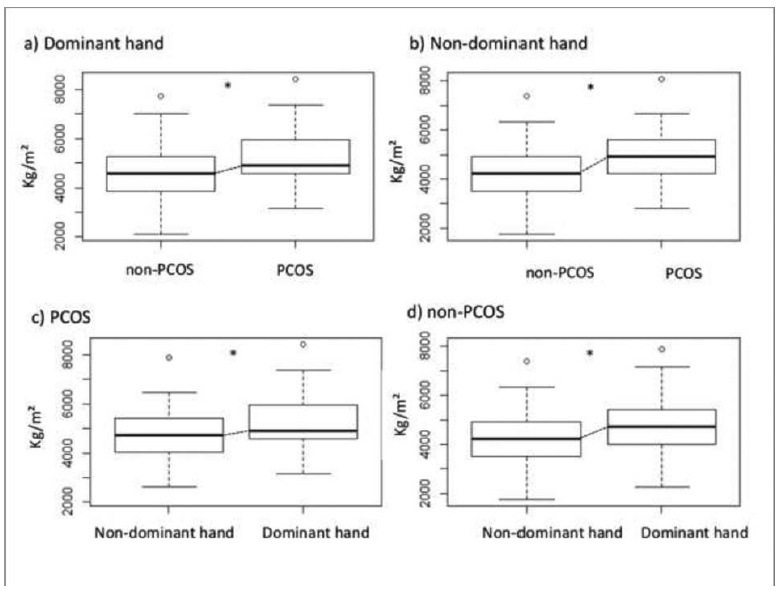
Women with PCOS had high serum levels of total testosterone (p < 0.01), androstenedione (p = 0.03), and insulin (p < 0.01), as well as high FAI (p < 0.01) and HOMA-IR (p = 0.01) scores. Compared with the non-PCOS group, the PCOS group had greater total lean mass in the dominant hand (p < 0.03) and greater HGS in both the dominant and the non-dominant hands (p < 0.01). The HGS was correlated with lean mass (p < 0.01).
Women with PCOS have greater HGS. This may be associated with age and BMI, and it may be related to lean mass. In addition, the dominance effect on muscle mass may influence the physical performance regarding HGS in women with PCOS.
Summary
Rev Bras Ginecol Obstet. 2020;42(12):811-819
The present study aimed to investigate the physical performance of handgrip strength (HGS) in women with polycystic ovary syndrome (PCOS).
A case-control study that included 70 women with PCOS and 93 agematched healthy women aged between 18 and 47 years with body mass index (BMI) between 18 Kg/m2-39.9 Kg/m2. The serum levels of total testosterone, androstenedione, insulin, estradiol, thyroid-stimulating hormone (TSH), prolactin, sex hormonebinding globulin (SHBG), and 17-hydroxyprogesterone (17-OHP) were measured. The free androgen index (FAI) and the homeostatic model assessment of insulin resistance (HOMA-IR) were calculated. The body composition regions of interest (ROIs) were assessed by dual-energy X-ray absorptiometry (DXA), and the handgrip strength (HGS) was evaluated for both the dominant and the non-dominant hands with a manual Sammons Preston (Bolingbrook, IL, US) bulb dynamometer.
Women with PCOS had high serum levels of total testosterone (p < 0.01), androstenedione (p = 0.03), and insulin (p < 0.01), as well as high FAI (p < 0.01) and HOMA-IR (p = 0.01) scores. Compared with the non-PCOS group, the PCOS group had greater total lean mass in the dominant hand (p < 0.03) and greater HGS in both the dominant and the non-dominant hands (p < 0.01). The HGS was correlated with lean mass (p < 0.01).
Women with PCOS have greater HGS. This may be associated with age and BMI, and it may be related to lean mass. In addition, the dominance effect on muscle mass may influence the physical performance regarding HGS in women with PCOS.
Summary
Rev Bras Ginecol Obstet. 2014;36(9):404-409
DOI 10.1590/SO100-720320140005073
To evaluate the effect of 8 weeks of functional training on body composition in postmenopausal women.
The study was conducted on 38 postmenopausal women, divided into two groups: Training Group (TG) and Control Group (CG). TG women (n=21) performed a program of physical exercise for a period of 8 weeks, 3 times a week on nonconsecutive days, with 90 minutes per session. For the same period, CG women (n=17) did not perform any systematic physical activity. All participants were assessed at baseline and after 8 weeks. The evaluations were performed by the same trained raters. Analysis of body composition was performed using dual-energy X-ray absorptiometry (DEXA), which allows estimation of body composition in the whole body and by segment. TG participants performed a functional exercise program 3 days a week (non-consecutive), with 11 stations consisting of exercises developed in circuit format sessions. The objectives of the exercises were the development of strength, agility, coordination and proprioception, followed by aerobic exercise (walking). After normality of the data was determined by the Shapiro-Wilk test (p<0.05), we applied the Student t-test for independent samples to check for possible differences in anthropometric variables and body composition between groups at both times of intervention (pre and post-test). All analyses were performed using the SPSS software v. 17.0 (SPSS Inc., Chicago, IL, USA) with the level of significance set at 5%.
At baseline, no significant difference was observed between groups regarding anthropometric body variables or age composition, indicating homogeneity of the groups. After 8 weeks of training, significant differences were observed between TG and CG regarding fat - CG=0.2±0.7 and TG=-0.4±0.5, total body fat (kg) - CG=0.2±1.3 and TG=-0.7±0.8, and total weight - CG=0.4±1.4 and TG=-0.6±1.1. Percent body fat was reduced in terms of absolute values, although without significance: CG=0.1±1.5 and TG=-0.8±1.5.
Functional training in circuit format can be used as a strategy to alter body composition in postmenopausal women, particularly in terms of reduction of adipose tissue. This is a model that promotes high adhesion on the part of the participants, suggesting that it is an attractive proposal for the investigated age group.
Summary
Rev Bras Ginecol Obstet. 2014;36(6):244-250
DOI 10.1590/S0100-720320140005004
This study investigated short-term changes in body composition, handgrip strength, and presence of lymphedema in women who underwent breast cancer surgery.
Ninety-five women participated in a cross-sectional study, divided into two groups: Control (n=46), with healthy women, and Experimental (n=49), with women six months after breast cancer surgery . The Experimental Group was subdivided into right total mastectomy (RTM, n=15), left total mastectomy (LTM, n=11), right quadrant (RQ, n=13), and left quadrant (LQ, n=10). It was also redistributed among women with presence (n=10) or absence (n=39) of lymphedema. Presence of lymphedema, handgrip strength, and body composition were assessed.
Trunk lean mass and handgrip strength were decreased in the Experimental Group. Total lean mass was increased in the LTM compared to RTM or LQ. Left handgrip strength in LTM was decreased compared to RTM and RQ and in LQ compared to RTM and RQ. Finally, total lean mass, trunk fat mass, trunk lean mass, right and left arm lean mass were increased in women with lymphedema.
Breast cancer survivors have changes in their body composition and in handgrip strength six months after surgery; however, the interaction between the type of surgery and its impact is unclear. Furthermore, women who developed lymphedema in this period showed more significant changes in the body composition, but they were not enough to cause impairment in handgrip strength.
Summary
Rev Bras Ginecol Obstet. 2014;36(4):176-181
DOI 10.1590/S0100-7203201400040003
To determine the relationship between total body and trunk fat mass and gait performance in postmenopausal women.
Thirty-nine postmenopausal women aged 50 years or more were studied. The following items were determined: weight and height to calculate body mass index (BMI), body composition using the technique of Dual-Energy X-ray Absorptiometry (DXA), and gait using baropodometry. The body composition variables used were total body fat, percent body fat and trunk fat, while the gait variables were percent double stance time and single stance time and gait speed. The women were divided into two groups according to the median for each body composition variable: less and more body fat, less and more percent body fat and less and more trunk fat. To compare the gait variables between groups, we used the Mann-Whitney test. To evaluate the possible relationships between body composition variables and gait variables, we used the Spearman correlation test. All analyses were performed with the level of significance set at 5%.
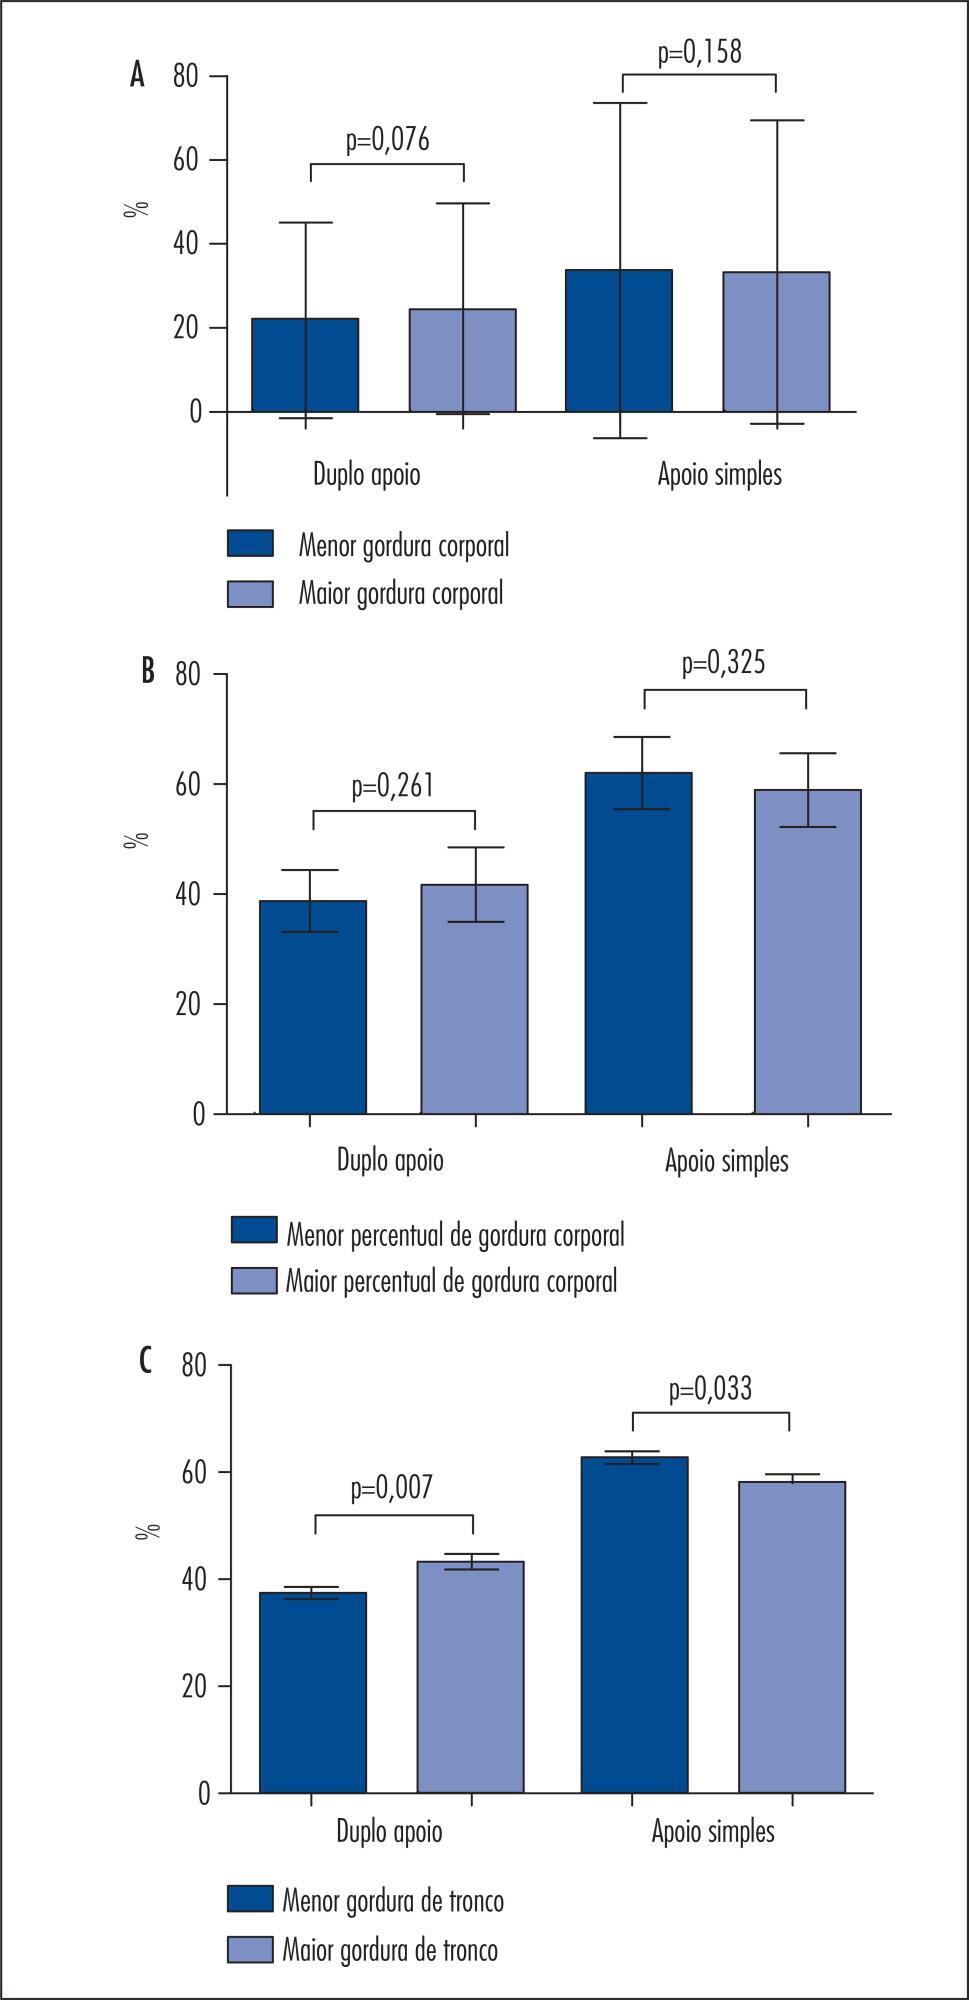
The group with more trunk fat showed longer double stance time (p=0.007) and lower values of single stance time (0.033) than the group with less trunk fat. We found significant and positive correlations between trunk fat and double stance time (R=0.40) and negative correlations between trunk fat and single stance time (R=-0.32).
Postmenopausal women with a greater amount of trunk fat tended to have impaired gait performance.
Summary
Rev Bras Ginecol Obstet. 2014;36(4):176-181
DOI 10.1590/S0100-7203201400040003
To determine the relationship between total body and trunk fat mass and gait performance in postmenopausal women.
Thirty-nine postmenopausal women aged 50 years or more were studied. The following items were determined: weight and height to calculate body mass index (BMI), body composition using the technique of Dual-Energy X-ray Absorptiometry (DXA), and gait using baropodometry. The body composition variables used were total body fat, percent body fat and trunk fat, while the gait variables were percent double stance time and single stance time and gait speed. The women were divided into two groups according to the median for each body composition variable: less and more body fat, less and more percent body fat and less and more trunk fat. To compare the gait variables between groups, we used the Mann-Whitney test. To evaluate the possible relationships between body composition variables and gait variables, we used the Spearman correlation test. All analyses were performed with the level of significance set at 5%.
The group with more trunk fat showed longer double stance time (p=0.007) and lower values of single stance time (0.033) than the group with less trunk fat. We found significant and positive correlations between trunk fat and double stance time (R=0.40) and negative correlations between trunk fat and single stance time (R=-0.32).
Postmenopausal women with a greater amount of trunk fat tended to have impaired gait performance.
Summary
Rev Bras Ginecol Obstet. 2014;36(2):84-89
DOI 10.1590/S0100-72032014000200007
To identify and relate body fat percentage (skin fold measures), body mass index
(BMI) and age at menarcheto aerobic capacity using the indirect VO2
maximum value (VO2 max) of girls in the second cycle of primary school.
A total of 197 girls aged 13.0±1.2 years on average, students from two public
schools in the city of Atibaia in São Paulo, were evaluated. Anthropometric
evaluation of skin folds was performed using the Slaughter protocol for teenage
girls, and BMI (kg/m2) was based on "Z score" (graphic of percentile)
according to WHO recommendations. The Léger protocol was used to determine
VO2 max. Pearson linear regression and the Student t-test were used
for statistical analysis.
22.3% of the girls were overweight and 3.5% were obese according to the
classification proposed by the WHO; 140 (71.1%) girls reported menarche. The
average age at menarche was 12.0±1.0 years and was significantly higher in the
group with normal BMI (12.2±0.9 years) than in the overweight or obese groups
(11.6±1.0 years). The average indirect VO2 max value was 39.6±3.7
mL/kg/min, ranging from 30.3 to 50.5 mL/kg/min. The advance of chronological age
and early age at menarche were positively correlated with lower VO2 max
values.
This study showed that 25.8% of the girls had aBMI value above WHO
recommendations. Girls with higher BMI and higher body fat percentage had lower
VO2 max. The earlier age at menarche and the advance of
chronological age were the most important factors for the reduction of aerobic
capacity. The ageat menarche was higher in girls with adequate BMI compared
tooverweight or obese girls.
Summary
Rev Bras Ginecol Obstet. 2013;35(4):153-158
DOI 10.1590/S0100-72032013000400004
PURPOSE: To analyze the relationship between physical activity and body composition in menopausal women. METHODS: The study included 62 menopausal women aged 50 years or more (61.2±7.6). The practice of physical activity was assessed with an accelerometer and is reported as minutes per week of low physical activity and moderate plus vigorous physical activity, and total physical activity in counts. Lean mass and total fat mass were assessed by dual-energy X-ray absorptiometry, and are reported as percentages. The relation between body composition variables and physical activity was evaluated by Spearman and Pearson correlation. Comparisons between groups were performed using the independent t test and Mann-Whitney test. RESULTS: The age group 59 years or older had higher mean values of total physical activity in counts (1,307.081 versus 2,843.840) and of minutes per week of moderate-vigorous physical activity (273 versus 156 minutes). Women who completed 150 minutes or more of moderate-vigorous physical activity had significantly lower total fat mass (43.8 versus 47.2 kg), higher lean mass (53.8 versus 49.6 kg) and lower BMI (27.7 versus 30.5 kg/m²) when compared to those with less than 150 minutes of physical activity per week. Only time spent in moderate activities showed a significant negative correlation with the percentage of total fat (r=-0.26, p<0.05), whereas total physical activity in counts correlated with the percentage of lean body mass (r=0,30), percentage of total fat (r=-0.32), trunk fat (r=-0.29), and BMI (r=-0.32); all correlations were statistically significant at p<0.05. CONCLUSION: menopausal women aged 50 years or more who spent more minutes in moderate and vigorous activity and higher total physical activity counts showed lower fat mass and higher lean mass.
Summary
Rev Bras Ginecol Obstet. 2012;34(9):414-419
DOI 10.1590/S0100-72032012000900005
PURPOSE: To evaluate the effect of an exercise program on fat mass (FM), visceral fat area (VFA), skeletal muscle mass (SMM) and skeletal muscle mass index (SMMI) of post-menopausal women. METHODS: A sample of 169 women (56.8±6.4 years) was randomized into an exercise group (EG, n=91) and a control group (CG=78). The first performed 12 months of physical exercise, including step, weight training and flexibility, with three weekly sessions of 60 minutes each. The basal metabolic rate (BMR) and the corporal composition were evaluated by octopolar InBody 720 bioimpedance and the food record method was considered. The variables modification rates were determined and the comparison of the average values was realized by Student's t-test, with the level of significance of 5%. RESULTS: In absolute terms, the CG increased (p<0.01) the FM (1.8%) and VFA (3.9 cm²) and worsened muscle condition (-1.06%), with consequences for BMR (-27.9 kcal/day). Differences were found (p<0.05) between the EG and the CG for Δ% FM (-4.2%), ΔVFA (-4.00 cm²), ΔSM (3.09%), ΔSMI (0.03%) and ΔBMR (2.9%). CONCLUSIONS: The results suggest that exercise attenuated the increase in the levels of total and central adiposity and muscle loss associated with menopause and aging.