Summary
Revista Brasileira de Ginecologia e Obstetrícia. 2024;46:e-rbgo9
To analyze the amount of muscle and the presence of sarcopenia in postmenopausal women using different methods, verifying the agreement between them as to skeletal muscle mass (SMM).
This cross-sectional observational study was conducted with postmenopausal women aged ≥ 50 years. SMM was obtained from a predictive equation, Bioelectrical Impedance (BIA), and Dual Energy X-Ray Absorptiometry (DXA). The skeletal muscle mass index (SMI) and the appendicular skeletal muscle mass index (ASMI) were calculated. The cut-off point of SMI was determined for the population itself. The agreement between the SMI obtained using the different methods was verified. Sarcopenia was diagnosed according to the criteria proposed by the European Working Group on Sarcopenia in Older People 2 (EWGSOP2). The significance level adopted for all tests was 5.0%.
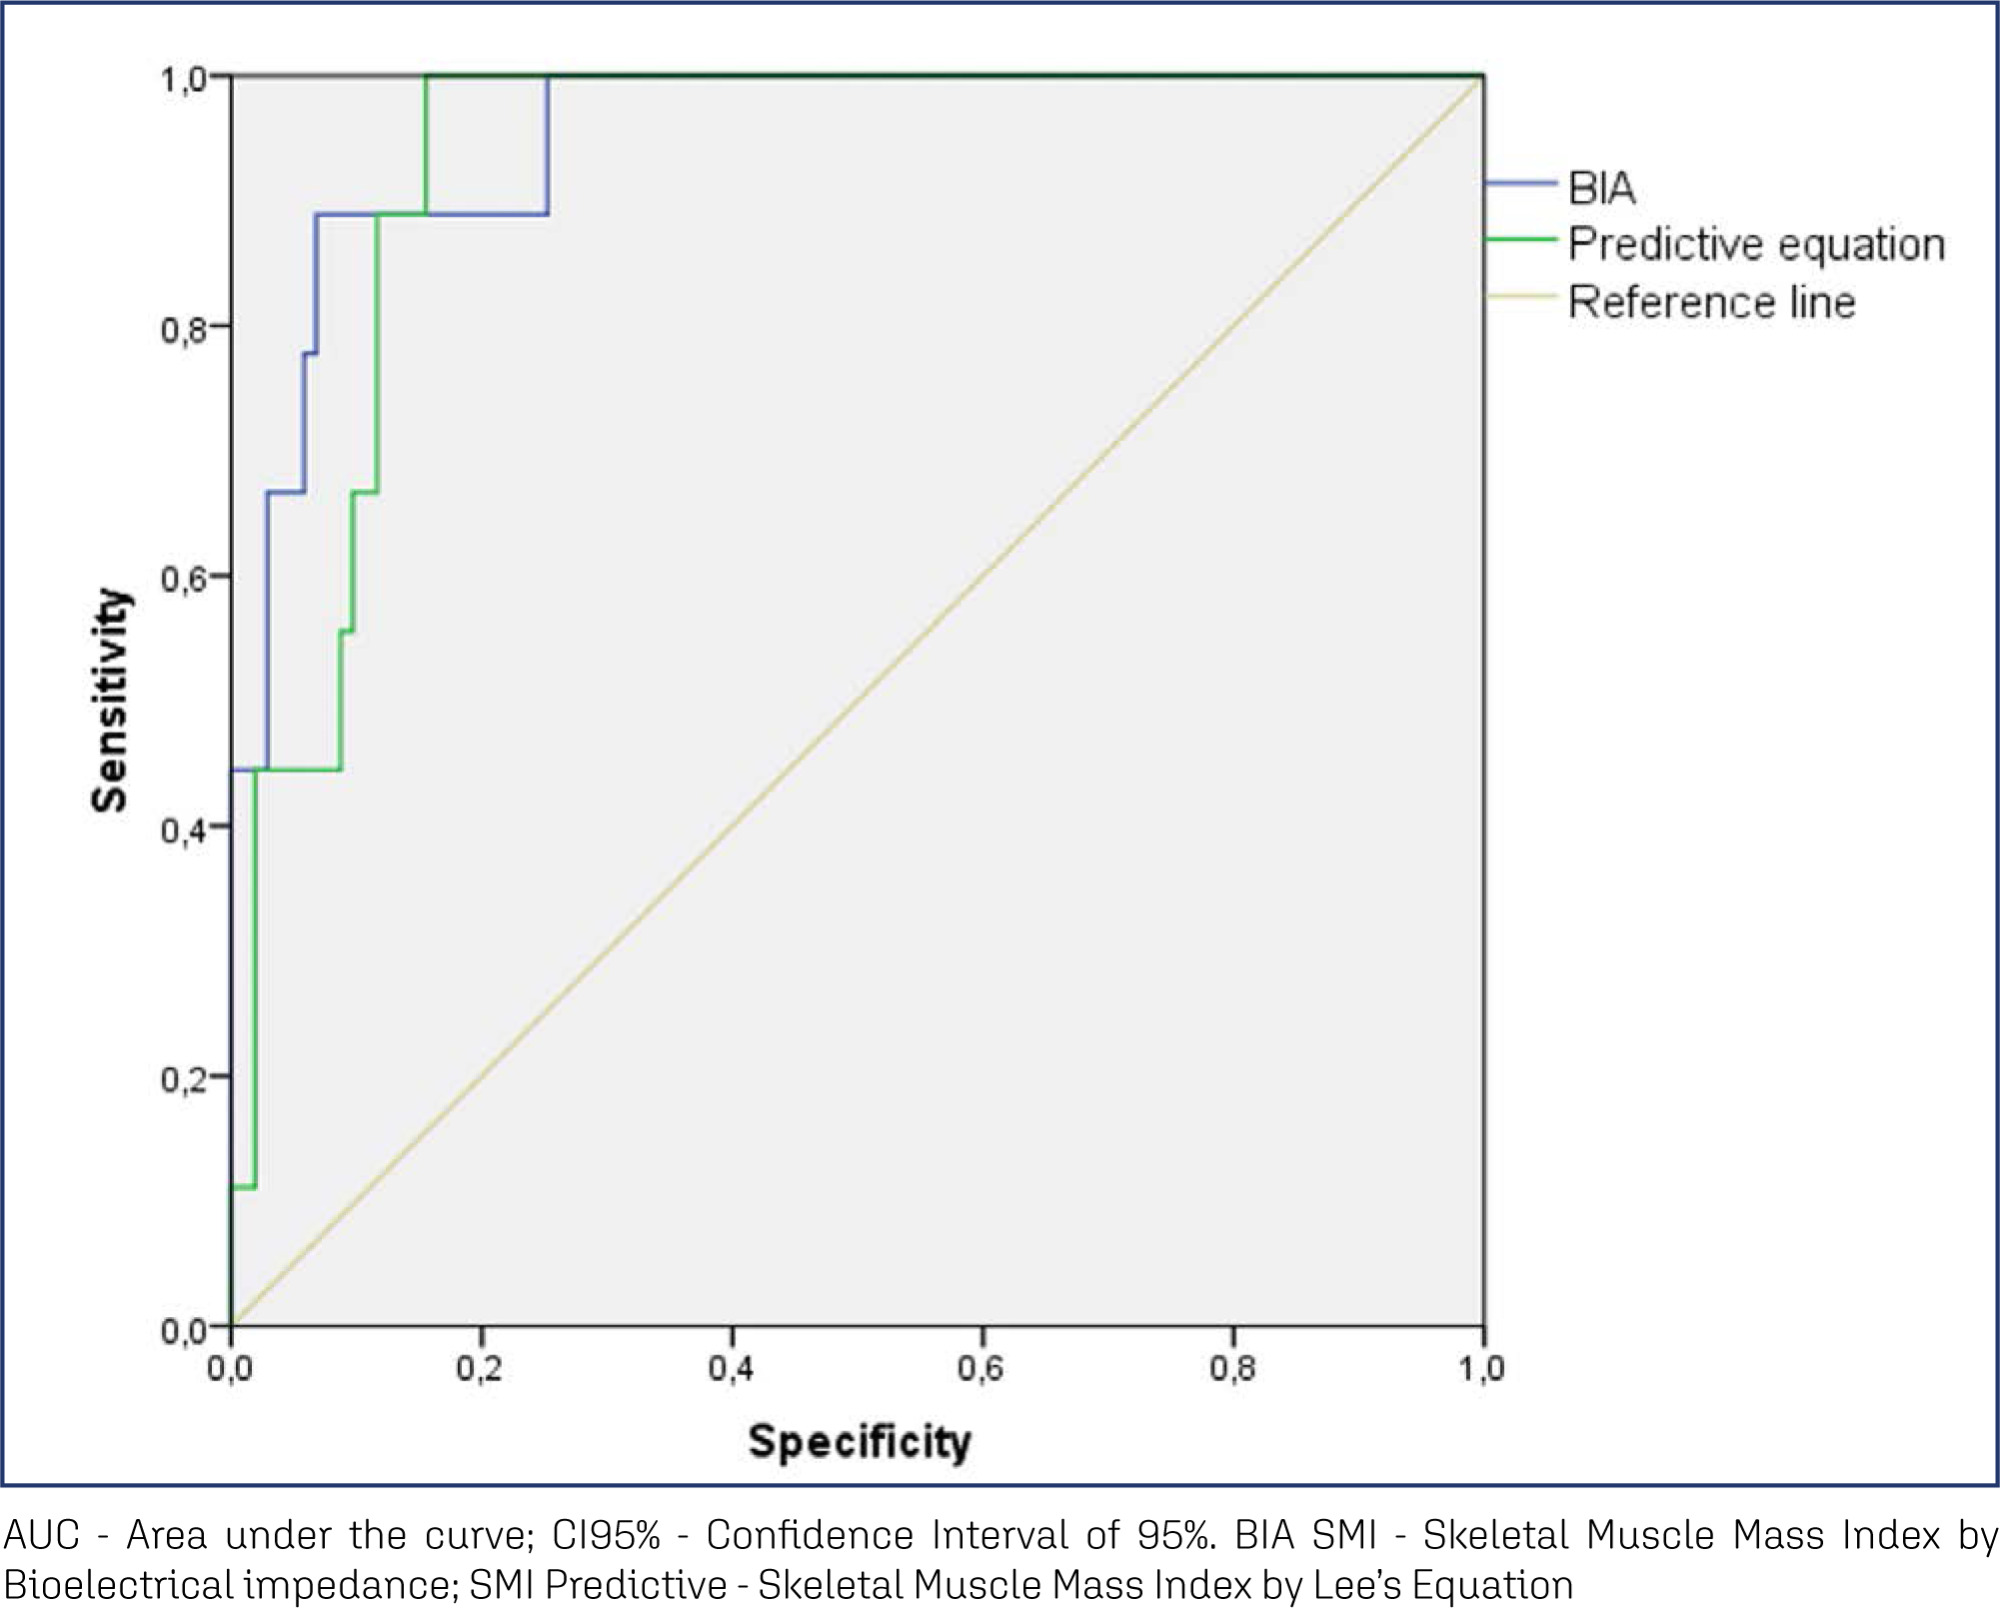
A total of 112 women were evaluated, with an average age of 66.1 ± 5.65 years. Among them, 51.8% were sufficiently active and 43.8% were overweight and obese. The SMI cut-offs were 6.46 kg/m2 for the predictive equation and 7.66 kg/m2 for BIA, with high sensitivity and specificity. There was an excellent agreement in the identification of SMM by the predictive equation (0.89 [0.824-0.917], p < 0.001) and BIA (0.92 [0.883-0.945], p < 0.001), in reference to DXA. The prevalence of sarcopenia was 0.9%, 1.8%, and 2.7% according to BIA, DXA, and the predictive equation, respectively.
The predictive equation showed the expected agreement in estimating skeletal muscle mass in postmenopausal women, offering a viable and accurate alternative.

Summary
Revista Brasileira de Ginecologia e Obstetrícia. 2016;38(8):399-404
To determine the diagnostic accuracy and the cutoff point of the variables conicity index, waist to height ratio and fat percentage to detect urinary incontinence in physically active older women.
A total of 152 women were analyzed. The instruments used were the International Physical Activity Questionnaire (IPAQ [Area 4]) to check the level of physical activity, and the Diagnostic Form to obtain sociodemographic data and presence of urinary incontinence. To calculate the conicity index, waist to height ratio and fat percentage, body mass, height and waist circumference were measured. Descriptive and inferential statistics were used. Cutoff points, sensitivity (S) and specificity (SP) were determined by receiver operating characteristic (ROC) curves. A 5% significance level was adopted.
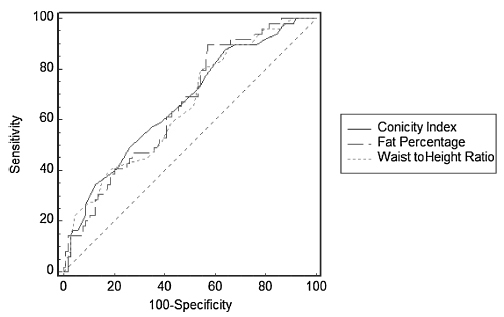
The prevalence of urinary incontinence was of 32.2%. The cutoff point with better sensitivity and specificity for the conicity index was 1.23 (S =87.8; SP =35.9); for the waist to height ratio, it was 0.57 (S =79.6; SP =45.6); and for the fat percentage, it was 39.71 (S =89.8; SP =42.7). The area under the ROC curve was 0.666 for the conicity index, 0.653 for the waist to height ratio, and 0.660 for the fat percentage.
The cutoff points for the anthropometric measurements conicity index, waist to height ratio and fat percentage indicate that these measures can be used to predict urinary incontinence in physically active older women. Furthermore, fat percentage seemed to be the best measure for this population.

Summary
Revista Brasileira de Ginecologia e Obstetrícia. 2016;38(4):189-195
Previous studies have shown that low birth weight (LBW) is associated with cardiovascular risk in late adulthood. Recent studies in adolescents suggest that modifiable factors may have greater influence on increased cardiovascular risk. This study aims to investigate the association between LBW and changes in anthropometric and biochemical risk factors during adolescence in a population with low average socioeconomic status.
In a retrospective double cohort, data of birth weight were extracted from hospital records of children born on the same day between 1992 and 2002. According to the World Health Organization, we classified the children as having LBW or normal birth weight. A total of 172 subjects among children, adolescents and adults were researched. We measured anthropometric and clinical data, lipid profile and glucose after an overnight fasting. The low and normal weight groups were compared using Mann-Whitney U, Fischer exact, Chi-square (2) and Student's t tests.
Pregnant women with preeclampsia delivered more newborns with LBW (p< 0.001). Anthropometric and clinical parameters were similar between groups. No differences were found in the family history of cardiovascular diseases (p= 0.1), family incomes (p= 0.8) and maternal school education (p= 0.8) between groups.
In this study, LBW did not increase cardiovascular disease risk factors in adolescents. We observed absence of association between low birth weight and poor health outcomes among adolescents with low socioeconomic status from an urban city in the Brazilian northeast.
Summary
Revista Brasileira de Ginecologia e Obstetrícia. 2013;35(6):268-273
DOI 10.1590/S0100-72032013000600006
PURPOSE: To describe the anthropometric and pregnancy characteristics of women with HIV/AIDS, assisted by the Brazilian National Health System and the birth weight of their newborns. METHODS: The participants were women assisted at public STD/AIDS clinics of the Municipal Health system of São Paulo. The anthropometric characteristics were evaluated by trained nutritionists and other information was obtained from the medical records. For comparison of the survey data to those of the general population, secondary maternal and pregnancy data were obtained from live birth certificates through the Live Birth Information System. Continuous variables were summarized as mean and standard deviation or as the 25th, 50th and 75th percentiles and minimum and maximum values. The other variables are presented as percentages. Means were compared by the Student's t-test or Kruskal-Wallis test depending on the fulfillment of assumptions, with the decision based on the p value. RESULTS: We found the presence of inadequate maternal nutrition according to triceps skinfold (60.9%). The BMI/gestational age showed the presence of underweight (18.5%) and overweight or obesity (40%). There was no association between disease status (HIV or AIDS) and weight, height, and lean or fat mass. Mean newborn birth weight was lower than the value for the general population without infection or disease. The results of this study indicate the need to develop adapted curves to allow a more accurate nutritional assessment of this population group.
Summary
Revista Brasileira de Ginecologia e Obstetrícia. 2012;34(6):268-273
DOI 10.1590/S0100-72032012000600005
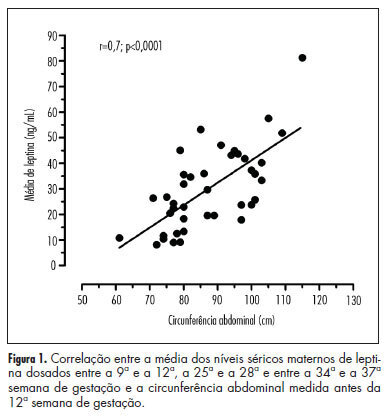
PURPOSE: To evaluate the correlation between maternal waist circumference measured before the 12th week of gestation and serum leptin levels during pregnancy, as well as to compare the leptin levels of women with and without abdominal obesity diagnosed in early pregnancy. METHODS: Prospective study including 40 pregnant women receiving low-risk prenatal care, older than 20 years, nonsmokers, with singleton pregnancies and without chronic disease. Waist circumference was measured before the 12th week and serum leptin levels were measured between the 9th and 12th, 25th and 28th and 34th and 37th weeks of gestation. According to waist circumference measurement, the cohort was divided into two groups: with and without abdominal obesity. The Mann-Whitney and χ² tests were used to assess the differences between groups. The Pearson correlation coeffient was used to assess the association between waist circumference and serum leptin levels during pregnancy. The level of significance was set at p<0.05. RESULTS: The mean weight and body mass index of patients with abdominal obesity (74.4±11.0 kg/28.9±4.1) was higher than that of patients without abdominal obesity (55.6±5.9 kg/21.1±2.4) (p=0.001). The mean leptin levels in pregnant patients with abdominal obesity (41.9±3.5 ng/mL) was higher than in patients without abdominal obesity (23.6±2.7 ng/mL) (p<0.0002). A positive correlation was obtained between the waist circumference measured during the same period and the mean serum leptin levels (r=0.7; p<0.0001). CONCLUSIONS: Waist circumference measured before the 12th week of pregnancy is a valid and simple method to predict the serum leptin levels throughout pregnancy. Pregnant women with abdominal obesity diagnosed before 12th week have higher mean serum leptin levels during pregnancy than those without abdominal obesity.

Summary
Revista Brasileira de Ginecologia e Obstetrícia. 2008;30(4):182-189
DOI 10.1590/S0100-72032008000400005
PURPOSE: to evaluate the anthropometric measures as predictors of cardiovascular and metabolic risk in non-transmissible chronic diseases in postmenopausal women. METHODS: a clinical and sectional study enrolling 120 sedentary postmenopausal women (amenorrhea for at least 12 months, age 45 to 70 years was conducted). Exclusion criteria included insulin-dependent diabetes and use of statins or hormone therapy within the preceding six months. Anthropometric indicators included: weight, height, body mass index (BMI=weight/height²), and waist circumference (WC). Metabolic profiles as total cholesterol (TC), HDL, LDL, triglycerides (TG), glycemia, and insulin were measured and the atherogenic index of plasma (AIP) and Homeostasis model assessment-insulin resistance (HOMA-IR) were calculated. One-way analysis of variance (ANOVA) and Odds Ratio (OR) were used in the statistical analysis. RESULTS: subjects were classified on average as overweight and showed central fat distribution. Overweight and obesity were observed in 76% and abdominal obesity in 87.3% of the patients. On average, TC, LDL and TG levels were higher than recommended in 67.8, 55.9 and 45.8% of the women, respectively, and HDL was low in 40.7%. Values of WC >88 cm were observed in 14.8% of women with normal weight, 62.5% overweight and 100% obesity p>0.05). On average, the values of AIP, TG, and HOMA-IR increased significantly along with values of BMI and WC, while decreased HDL (p<0.05). Among women with WC >88 cm, a risk association was observed with low HDL (OR=5.86; 95%CI=2.31-14.82), with higher TG (OR=2.61; 95%CI=1.18-5.78), with higher AIP (OR=3.42; 95%CI=1.19-9.78) and with IR (OR=3.63; 95%CI=1.27-10.36). There was a risk of low HDL (OR=3.1; 95%CI=1.44-6.85) with increased obesity (BMI>30 kg/m²). CONCLUSIONS: in the postmenopausal women, the simple measure of WC can predict cardiovascular and metabolic risk of non-transmissible chronic diseases.
Summary
Revista Brasileira de Ginecologia e Obstetrícia. 2007;29(10):511-518
DOI 10.1590/S0100-72032007001000004
PURPOSE: to analyze the association between maternal pre-gestational nutritional status and maternal outcomes - hypertensive disorders of pregnancy, gestational diabetes, vitamin A deficiency, and anemia - and the newborn outcome - low birth weight. METHODS: cross-sectional study, with 433 adult puerperal women (> 20 years old) and their newborns, attending the Maternidade Escola of Universidade Federal do Rio de Janeiro (UFRJ). Data was collected through interviews and access to their medical records. Maternal pre-gestational nutritional status was established through pre-gestational body mass index according to the cut-offs for adult women defined by the World Health Organization (WHO), in 1995. The association between gestational outcomes and pre-gestational nutritional status was estimated through odds ratio (OR) and a 95% confidence interval (95%CI). RESULTS: frequency of pre-gestational weight deviation (low weight, overweight and obesity) was 31.6%. Considering the pre-gestational nutritional status, overweight and obese women presented a lower weight gain than eutrophic and low-weight women (p<0.05). Women with pre-gestational obesity presented a higher risk of developing hypertensive disordens of pregnancy (OR=6.3; 95%CI=1.9-20.5) and those with low pre-gestational weight were more likely to give birth to low birth weigh infants (OR=7.1; 95%CI=1.9-27.5). There was no evidence of the association between pre-gestational nutritional status and the development of anemia, vitamin A deficiency and gestational diabetes. The mean weight gain among overweight and obese pregnant women was significantly lower when compared to eutrophic and low-weight pregnant women (p=0.002, p=0.049, p=0.002, p=0.009). CONCLUSIONS: the high number of women with pre-gestational weight deviation reinforces the importance of a nutritional guidance that favors a good nutritional state and reduces the risks of maternal and newborn adverse outcomes.
Summary
Revista Brasileira de Ginecologia e Obstetrícia. 2005;27(6):303-309
DOI 10.1590/S0100-72032005000600003
PURPOSE: to diagnose intrauterine growth restriction (IGR) and its connection with early neonatal morbidity and mortality, through Roher's ponderal index (PI). METHODS: this was a retrospective, descriptive study of transversal cohort, in which 2741 newborns (NB) were included, 2053 of them from healthy pregnant women, 228 from women with mild pregnancy-related hypertension, 52 from those with severe pregnancy-related hypertension, 25 from those with mild pregnancy-related hypertension that evolved to eclampsia, 136 from those with premature membrane rupture, and 247 from women who smoked along gestation. Roher's PI was calculated by the equation: PI = weight/height ³ x 100 and the values 2.25 and 3.10 of Lubchenco's 10 and 90 percentiles were used to classify the types of IGR. IGR was classified as asymmetric for NB with PI < 2.25 and weight lower than percentile 10, as symmetric, with PI from 2.25 to 3.10 and weight lower than percentile 10, and adequate for gestational age with PI from 2.25 to 3.10, and weight from 10 to 90 percentiles. Statistical analysis was performed using the non-paired t test, the non-parametric chi2 test and Fisher's exact test, with significance set at a value of p<0.05. RESULTS: low birth weight (< 2,500 g) was present in 3.6% (100/2741) of the cases, while the rate of IGR diagnosed through PI was 15.7% (430/2741), 14.0% being asymmetric and 1.7% symmetric. The most frequent complication among the asymmetric IGRNB was transient tachypnea (8.3%), followed by asphyxia (5.7%) and infection (2.6%). Transient tachypnea was present in 6.5% of symmetric IGRNB, followed by asphyxia (4.3%), meconium aspiration syndrome (2.2%), hypoglycemia (2.2%) and infection (2.2%). Early neonatal death was similar for NB with restricted IGR and adequate IGR for gestational age, both groups reaching a rate of 0.3%. CONCLUSIONS: Rohrer's PI was able to diagnose the different IGR patterns, which would not be known if the birth weight had been calculated in terms of gestational age. The asymmetric NB presented a higher incidence of transient tachypnea and asphyxia, without statistical significance in relation the other IGR patterns. The frequency of early neonatal death was similar for the asymmetric and adequate for gestational age NB groups.