Summary
Revista Brasileira de Ginecologia e Obstetrícia. 2011;33(2):87-92
DOI 10.1590/S0100-72032011000200006
PURPOSE: to determine the dietary consumption of pregnant women, by assessing the intake of macronutrients and micronutrients, and to verify the maternal weight gain during pregnancy. METHODS: a retrospective study conducted from June 2002 to June 2008 with pregnant women who received nutritional counseling during prenatal care at a university hospital, grouped according to anthropometric nutritional status classified by pregestational body mass index (BMI). The dietary intake was analyzed according to the information obtained in food frequency interviews, performed at the first evaluation of pregnant women in the service of nutrition to obtain data about eating habits, and the intake of macronutrients and micronutrients was calculated. The pregnant women received nutritional counseling, and the maternal weight gain was investigated. RESULTS: a total of 187 pregnant women who received nutritional counseling were analyzed. Twenty-three (12.2%) were underweight, 84 (45.0%) normal weight, 37 (19.8%) overweight, and 43 (23.0%) obese. The underweight pregnant women had lower consumption of lipids when compared to the normal weight group (101.4 versus 137.3 g; p=0.043). The average iron intake was higher in normal weight pregnant women (14.6 mg/d) compared to the overweight (12.2 mg/d) or obese (10.9 mg/d; p<0.001) groups. The average intake of folate was higher in normal weight pregnant women compared to obese ones (336.5 µg/d versus 234.5 µg/d; p=0.002). Excessive maternal weight gain was significantly (p=0.009) more frequent in overweight (56.7%) and obese (39.5%) pregnant women compared to underweight (17.4%) and normal weight (31.0%) women. CONCLUSIONS: The maternal weight gain above recommended levels was associated with overweight and obesity. The dietary intake of pregnant women differs according to maternal anthropometric nutritional status, with a lower daily intake of iron in overweight and obese women and a lower intake of folate in obese ones, a fact that reinforces the importance of prenatal vitamin supplementation.
Summary
Revista Brasileira de Ginecologia e Obstetrícia. 2011;33(2):70-74
DOI 10.1590/S0100-72032011000200003
OBJECTIVE: to correlate complaints of stress urinary incontinence and the results of a one-hour pad test in pre- and postmenopausal women. METHODS: cross-sectional study conducted on 60 postmenopausal volunteers divided into two groups: one consisting of 34 women with involuntary loss of urine due to stress incontinence and the other consisting of 26 women without involuntary loss of urine. A control group of 15 premenopausal women with normal menstrual cycles and no urinary complaints was also used. All women underwent clinical and laboratory analysis as well as the one-hour pad test. Patients were considered to be incontinent when sanitary pad weight post-test was more than 1 g. Data were submitted to descriptive statistics, parametric ANOVA, post-hoc Tukey test and Pearson's correlation. RESULTS: all postmenopausal women presented with stress urinary incontinence during the pad test, both those with urinary loss (4 g) and with no previous loss (3.5 g). A strong correlation was observed between urinary loss and time since menopause (r=0.8; p<0.01) and body mass index (r=0.7; p=0.01). Premenopausal women were continent during the pad test (0.4 g). CONCLUSIONS: the results of the one-hour pad test showed that all postmenopausal women exhibited stress urinary incontinence, including those without urine loss on effort. Urine loss was correlated with time since menopause and body mass index.
Summary
Revista Brasileira de Ginecologia e Obstetrícia. 2010;32(11):536-540
DOI 10.1590/S0100-72032010001100004
PURPOSE: to evaluate the impact of body mass index (BMI) on in vitro fertilization/intracytoplasmic sperm injection (IVF/ICSI) outcomes performed at the Human Reproduction Center of Faculdade de Medicina do ABC. METHODS: retrospective data from 488 IVF cycles of 385 patients. Patients were classified into two groups according to BMI: normal weight (18.5-24.9 kg/m²) and overweight/obesity (>25 kg/m²). We evaluated the dose of recombinant follicle stimulating hormone (FSHr), the cancellation rates for ovarian cycle response, and the results of the assisted reproduction laboratory such as number of oocytes, number of good quality embryos, number of embryos transferred, and pregnancy rates, chemical pregnancy rates, miscarriage rate and live birth rate. The t test was used for comparison of quantitative variables between groups, and the χ2 test for comparison between qualitative variables. P values <0.05 were considered significant. RESULTS: considering ovulation induction characteristics, there was no statistically significant difference between groups regarding the FSHr dose administered or the cancellation rates, p=0.47 and p=0.85, respectively. Regarding laboratory findings, the number of oocytes retrieved per cycle was similar for both groups (p=0.09), as also was the number of good quality embryos obtained and transferred (p=0.7 and p=0.6). The pregnancy rate per embryo transfer was 27.6% for the group of normal weight and 29.6% for the overweight/obese group (p=0.76). Miscarriage rates and birth rates were similar for both groups, p=0.54 and p=0.94. CONCLUSION: BMI did not influence IVF/ICSI outcomes evaluated.
Summary
Revista Brasileira de Ginecologia e Obstetrícia. 2010;32(9):454-458
DOI 10.1590/S0100-72032010000900007
PURPOSE: to evaluate and compare the effects of body mass index (BMI) on the severity of female urinary incontinence (UI) using the quality of life questionnaire King's Health Questionnaire (KHQ), variables of urodynamic studies and the medical history taken. METHODS: cross-sectional clinical study. We selected 65 patients with stress urinary incontinence (SUI) who were divided into three groups: Group I (BMI: 18-25 kg/m²), Group II (BMI: 25-30 kg/m²) and Group III (BMI>30 kg/m²). The KHQ domains were compared between these groups. In addition, some clinical history urodynamic data (presence of nocturia, enuresis, urgency and urge incontinence) were also related to BMI by calculating the Odds Ratio (OR). The BMI in the presence and absence of non-inhibited detrusor contractions and Valsalva leak point pressure (VLPP) <60 or > 60 cmH2O were evaluated. Finally, the correlation between BMI and the nine KHQ domains has been tested in order to detect some association. RESULTS: the KHQ did not record deterioration of quality of life in women with UI with increasing BMI in any of its areas. The OR for the presence of enuresis in relation to a BMI was 1.003 [CI: 0.897-1.121], p=0.962. The OR for nocturia was 1.049 [CI: 0.933-1.18], p=.425. The OR for urgency was 0.975 [CI: 0.826-1.151], p=0.762, and the OR for incontinence was 0.978 [CI: 0.85-1.126], p=0.76. We studied the BMI in patients with and without non-inhibited detrusor contractions and detected medians of 26.4±4.8 and 28.3±5.7 kg/m², respectively (p=0.6). Similarly, the median BMI values for the groups with VLPP <60 and >60 cmH2O were 29.6±4.1 and 27.7±5.7 kg/m², respectively (p=0.2). Finally, we failed to demonstrate an association between BMI and any of the nine KHQ domains by means of the Spearman correlation. CONCLUSION: there was no association of KHQ scores with BMI. There was also no correlation between the parameters of clinical history and of the urodynamic study with BMI.
Summary
Revista Brasileira de Ginecologia e Obstetrícia. 2009;31(8):380-384
DOI 10.1590/S0100-72032009000800002
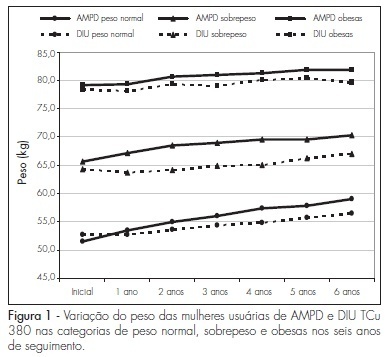
PURPOSE: to determine weight variation in women with different Body Mass Index (BMI) in use of trimestral injections of depot-medroxyprogesterone acetate (DMPA), and compare it to women users of a non-hormonal method. METHODS: retrospective study with the chart review of 226 DMPA users and 603 controls, users of DIU TCu380A. Women were distributed in categories, according to their initial BMI, as having normal weight (<25 kg/m²), overweight (25 to 29,9 kg/m²) and being obese (>30 kg/m²), and were followed-up for six years, with yearly measurements of weight and BMI. The statistic test ANOVA was used to measure the weight variation among the groups in each BMI category every year. RESULTS: the average age at the onset of the method employed was higher in the study group than in the controls, in all the BMI categories: 31.6±SD 7.1 X 27.4±SD 5.5 in the normal weight category (p<0.0001); 37.3±SD 6.8 X 29.2±SD 6.0 in the overweight category (p<0.0001); and 35.3±SD 6.4 X 29.7±SD 5.8 among obese women (p<0.0001). DMPA users showed weight increase as compared to the controls in the overweight category (p=0.0082); and the weight increase along the observation period was also higher among the DMPA users than among the controls, for the normal weight (p<0.0001) and overweight (p=0.0008) categories. In the obese group, there was no BMI variation between the groups, nor along the period during which they were using the method. CONCLUSIONS: there was no change in weight gain among DMPA users from the obese category. Prospective studies should be done with metabolic tests to establish the determining factors of weight gain in normal and overweight women.

Summary
Revista Brasileira de Ginecologia e Obstetrícia. 2000;22(4):229-233
DOI 10.1590/S0100-72032000000400007
Purpose: to evaluate the effects of hormone replacement therapy on the body mass index of postmenopausal women. Methods: for this purpose, 166 users and 136 non-users of hormone replacement were evaluated retrospectively during a period of three years. All women were assisted at the Menopause Outpatient Clinic of CAISM - UNICAMP, where the variations in this parameter were evaluated at the end of each year in relation to the initial parameters. The data analysis was performed through chi² test, Student's t test, and Mann-Whitney test. Results: we observed no significant variations in the body mass index, when comparing users and non-users during the three years of observation. Conclusion: hormone replacement therapy did not produce changes in this parameter in women properly assisted during its use.
Summary
Revista Brasileira de Ginecologia e Obstetrícia. 2005;27(1):37-43
DOI 10.1590/S0100-72032005000100008
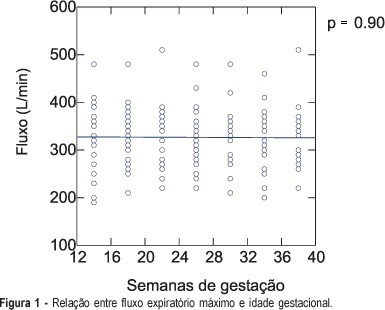
PURPOSE: to investigate the normal peak expiratory flow values in healthy pregnant women employing a portable expiratory apparatus (Mini-Wright Peak Flow Meter), and to relate the obtained measurements to each patient's height, body mass index (BMI) and age, along gestation. METHODS: a longitudinal prospective study including 26 pregnant women followed up from the first trimester to the 36th week of gestation and examined every four weeks. On the occasion of seven visits, the pregnant women performed forced exhaling into a portable expiratory apparatus three times, with the highest value being considered the peak expiratory flow. All measurements were made under the same investigator's supervision in order to reduce the margin of error. Pearson coefficient was used to calculate the correlation between flow and BMI, between flow and patient's height, and between flow and patient's age. RESULTS: the variation in flow values during pregnancy can be determined by flow = 328.32 -0.07 x week, with a Pearson coefficient equal to zero. To determine whether there was a difference in the correlation coefficients between BMI and flow, we compared the lowest coefficient (0.47 for week 30, flow = 123.49 + 7.64 x BMI) with the highest coefficient (0.59 for week 34, flow = 87.77 + 9.05 x BMI) of each studied time interval and obtained a value of 0.22, indicating a good correlation between the flow and BMI variables. There was a positive correlation between height and flow (Pearson = 0.61), with flow = -477.47 + 497.38 x height. The correlation coefficient between flow and age was 0.24, with the equation obtained in this case being non-linear. CONCLUSIONS: peak expiratory flow values did not change along gestation. Higher flows were observed in taller women. Pregnant women with a higher BMI before gestation presented higher flows. There was no correlation between flow and maternal age.

Summary
Revista Brasileira de Ginecologia e Obstetrícia. 2004;26(6):429-433
DOI 10.1590/S0100-72032004000600002
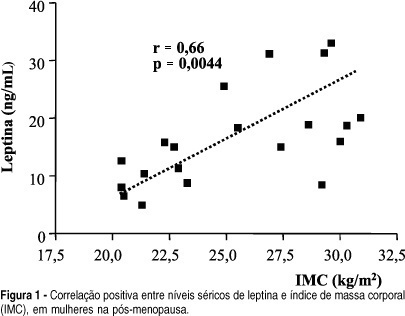
OBJECTIVE: to correlate serum leptin concentration with bone mineral density (BMD) in postmenopausal women. METHODS: twenty-two healthy postmenopausal women were included in the present study. BMD was measured by dual energy X-ray absorptiometry at the lumbar spine and femoral neck. Serum leptin concentrations were determined using an immunoradiometric assay. Statistical analysis was performed by ANOVA and Dunn and Pearson's correlation tests. RESULTS: mean BMD values were 0.898 ± 0.140 g/cm² at the lumbar spine and 0.760 ± 0.152 g/cm² at the femoral neck. Mean serum leptin concentration was 17.2 ± 9.4 ng/ml and no significant differences were observed among women with normal BMD, osteopenia and osteoporosis (18.6 ± 7.8, 18.9 ± 9.9 and 15.6 ± 10.6, respectively; p > 0.05). No significant correlations were observed between serum leptin levels and BMD measurements at the lumbar spine and femoral neck, when the whole sample was considered and when patients were divided into groups with osteoporosis and/or osteopenia and a control group. We observed a positive significant correlation between serum leptin levels and body mass index (BMI) (r = 0.66; p = 0.0044). CONCLUSIONS: there was no direct correlation between leptin and BMD in postmenopausal women, although we observed positive significant correlation between leptin and BMI. This fact indicates a possible indirect effect of leptin on bone metabolism.
