Summary
Revista Brasileira de Ginecologia e Obstetrícia. 2023;45(10):557-561
12-11-2023
We compared thyroid volume (TV) and presence of nodular goiter (NG) in pregnant vs. non-pregnant women in an iodine-sufficient area. We also evaluated the relationship between gestational age, parity, and TV in the pregnant women group, and determined the 2.5th and 97.5th percentiles of normal TV in pregnancy.
This cross-sectional study included 299 healthy women (216 pregnant) without previous thyroid diseases. Thyroid ultrasounds were performed and compared between pregnant and non-pregnant women. The range of normal distribution of TV (2.5th and 97.5th percentiles) in pregnancy was determined after excluding individuals with positive thyroid antibodies, NG, and/or abnormal serum thyrotropin (TSH) or free thyroxine (FT4).
Thyroid volume was larger among pregnant compared to non-pregnant women (8.6 vs 6.1 cm3; p< 0.001) and was positively correlated with gestational age (rs = 0.221; p = 0.001), body mass index (BMI, rs 0.165; p = 0.002), and FT4 levels (rs 0.118 p = 0.021). Nodular goiter frequency did not differ between the two groups. There was a negative correlation between TV and TSH (rs -0.13; p = 0.014). Thyroid volume was lower among primiparous compared to multiparous patients (7.8 vs 8.9; p< 0.001) and was positively correlated with parity (rs 0.161; p = 0.016). The 2.5th and 97.5th percentiles of TV were 4.23 and 16.47 cm3, respectively.
Thyroid volume was higher in pregnant compared to non-pregnant women and was positively related to parity, BMI, and gestational age in a normal iodine status population. Pregnancy did not interfere with the development of NG.
Summary
Revista Brasileira de Ginecologia e Obstetrícia. 2019;41(4):220-229
06-19-2019
Different intrauterine environments may influence the maternal prepregnancy body weight (BW) variation up to 6 months postpartum. The objective of the present study was to verify the association of sociodemographic, obstetric, nutritional, and behavioral factors with weight variation in women divided into four groups: hypertensive (HM), diabetic (DM), smokers (SM), and control mothers (CM).
It was a convenience sample of 124 postpartum women recruited from 3 public hospitals in the city of Porto Alegre, state of Rio Grande do Sul, Brazil, between 2011 and 2016.Multiple linear regressions and generalized estimating equations (GEE) were conducted to identify the factors associated with maternal weight variation. For all GEE, the maternal weight measurements were adjusted for maternal height, parity, educational level, and the type of delivery, and 3 weight measurements (prepregnancy, preceding delivery, and 15 days postpartum) were fixed.
A hierarchical model closely associated the maternal diagnosis of hypertension and a prepregnancy body mass index (BMI) classified as overweight with maternal weight gain measured up to the 6th month postpartum (the difference between the maternal weight at 6months postpartum and the prepregnancy weight). These results showed that the BW of the HM group and of overweight women increased ~ 5.2 kg 6 months postpartum, compared with the other groups. Additionally, women classified as overweight had a greater BW variation of 3.150 kg.
This evidence supports the need for specific nutritional guidelines for gestational hypertensive disorders, as well as great public attention for overweight women in the fertile age.
Summary
Revista Brasileira de Ginecologia e Obstetrícia. 2018;40(4):188-195
04-01-2018
To analyze the association between the indirect methods of evaluating insulin resistance (IR) and blood pressure, anthropometric and biochemical parameters in a population of polycystic ovary syndrome (PCOS) patients.
Cross-sectional study performed at the Hospital Universitário de Brasília (HUB, in the Portuguese acronym) involving PCOS patients diagnosed from January 2011 to January 2013. Four indirect methods, namely, fasting blood insulin level, fasting glucose/insulin ratio (G/I), homeostatic model-assessment-insulin resistance (HOMA-IR), and the quantitative insulin sensitivity check index (QUICKI), were used to obtain the IR diagnosis. The data were analyzed using the test of proportions, the Chisquare test, and Fisher exact test, when indicated.
Out of the 83 patients assessed, aged 28.79 ± 5.85, IR was found in 51.81- 66.2% of them using the G/I ratio and the QUICKI, respectively. The test of proportions did not show a significant difference between the methods analyzed. The proportion of IR diagnoses was statistically higher in obese women than in women with normal body mass index (BMI). We observed a statistically significant association between all the methods for diagnosing IR and BMI, waist circumference (WC) and lipid accumulation product (LAP). With regards to arterial hypertension (AH), we observed a significant association according to three methods, with the exception of the ratio G/I.
Insulin resistance prevalence varied according to the diagnostic method employed,with no statistical difference between them. The proportion of IR diagnoses was statistically higher in obese women than in women with normal BMI.We observed a significant association between IR andWC, BMI, LAP, as well as dyslipidemia and AH in a high proportion of patients.
Summary
Revista Brasileira de Ginecologia e Obstetrícia. 2017;39(11):608-613
11-01-2017
The aim of this study was to evaluate the health aspects of Brazilian women older than 65 years of age.
This was a retrospective study that included 1,001 Brazilian women cared for in the gynecological geriatric outpatient office of our institution. We report a crosssectional analysis of female adults aged over 65 years, including data on demographics, clinical symptoms such as vasomotor symptoms, associated morbidities, physical examination and sexual intercourse. We used the chi-squared test to assess the data.
The age of the patients on their first clinic visit ranged from65 to 98 years, with a mean age of 68.56 ± 4.47 years; their mean age at the time of natural menopause was 48.76 ± 5.07 years. The most frequent clinical symptoms reported during the analyzed period were hot flashes (n = 188), followed by arthropathy, asthenia, and dry vagina. The most frequent associated morbidities after 65 years of age were systemic arterial hypertension, gastrointestinal disturbance, diabetes mellitus, and depression, among others. The assessment of the bodymass index (BMI) found decreases inBMIwith increased age. At the time of the visit, 78 patients reported sexual intercourse. The majority of women reporting sexual intercourse (89.75%, n = 70) were between 65 and 69 years of age, 8.97% (n = 7) were between 70 and 74 years of age, and only 1.28% (n = 1) of those were aged older than 75 years.
Our findings suggested that vasomotor symptoms can persist after 65 years of age. There was a significant decrease in sexual intercourse with increased age. The cardiovascular disturbances in our study are health concerns in these women.
Summary
Revista Brasileira de Ginecologia e Obstetrícia. 2017;39(7):330-336
07-01-2017
To assess the impact of pre-pregnancy obesity (body mass index [BMI] ≥30 kg/m2) on the gestational and perinatal outcomes.
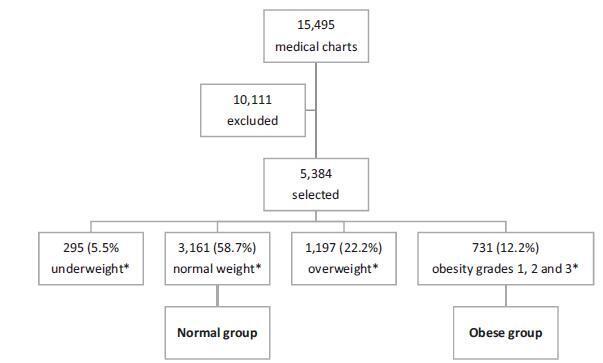
Retrospective cohort study of 731 pregnant women with a BMI ≥30 kg/m2 at the first prenatal care visit, comparing them with 3,161 women with a BMI between 18.5 kg/m2 and 24.9 kg/m2. Maternal and neonatal variables were assessed. Statistical analyses reporting the demographic features of the pregnant women (obese and normal) were performed with descriptive statistics followed by two-sided independent Student’s t tests for the continuous variables, and the chi-squared (χ2) test, or Fisher’s exact test, for the categorical variables. We performed a multiple linear regression analysis of newborn body weight based on the mother’s BMI, adjusted by maternal age, hyperglycemic disorders, hypertensive disorders, and cesarean deliveries to analyze the relationships among these variables. All analyses were performed with the R (R Foundation for Statistical Computing, Vienna, Austria) for Windows software, version 3.1.0. A value of p < 0.05 was considered statistically significant.
Obesity was associated with older age [OR 9.8 (7.8-12.2); p < 0.01], hyperglycemic disorders [OR 6.5 (4.8-8.9); p < 0.01], hypertensive disorders [OR 7.6 (6.1-9.5); p < 0.01], caesarean deliveries [OR 2.5 (2.1-3.0); p < 0.01], fetal macrosomia [OR 2.9 (2.3-3.6); p < 0.01] and umbilical cord pH [OR 2.1 (1.4-2.9); p < 0.01). Conversely, no association was observed with the duration of labor, bleeding during labor, Apgar scores at 1 and 5 minutes after birth, gestational age, stillbirth and early neonatal mortality, congenital malformations, and maternal and fetal injury.
We observed that pre-pregnancy obesity was associated with maternal age, hyperglycemic disorders, hypertension syndrome, cesarean deliveries, fetal macrosomia, and fetal acidosis.

Summary
Revista Brasileira de Ginecologia e Obstetrícia. 2017;39(1):14-20
01-01-2017
Obesity is associated with an increased risk for breast cancer. Recent studies have shown that aromatase inhibitors may be less effective in women with a high body mass index (BMI). The aim of this study was to establish the relationship between the BMI and plasma estrone and estradiol levels in postmenopausal women with hormone receptor-positive breast cancer using anastrozole.
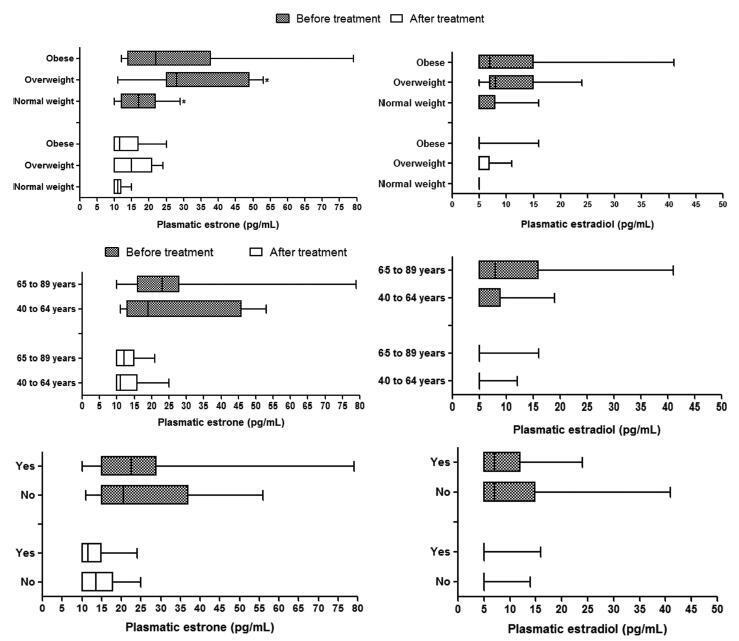
In this cohort study, the patients were divided into three groups according to BMI (normal weight, overweight and obese) to compare and correlate plasma hormone levels before starting anastrozole hormone therapy and three months after treatment. Plasma hormone levels were compared for age and use of chemotherapy.
A statistically significant reduction in estrone and estradiol levels was observed between baseline and three months after starting the anastrozole treatment (p < 0.05). There was no statistically significant difference in plasma estrone and estradiol levels among the BMI groups (p > 0.05), but a significant reduction in plasma estrone levels was observed after three-months' treatment relative to baseline in all groups, as well as a reduction in estradiol in the obese group (p < 0.05). The use of chemotherapy and age > 65 years had no influence on plasma steroid levels.
Changes in estrone and estradiol levels in the studied groups were not associated with BMI, chemotherapy or age.

Summary
Revista Brasileira de Ginecologia e Obstetrícia. 2014;36(11):503-508
11-01-2014
DOI 10.1590/S0100-720320140005081
To evaluate variations in the body mass index in patients undergoing adjuvant chemotherapy for breast cancer, and to associate these changes with patient's age and adjuvant chemotherapy regimen.
We performed a retrospective cohort study in order to correlate any variation in the body mass index before and after adjuvant chemotherapy with patient's age and adjuvant chemotherapy regimen. Patients who received any form of prior hormone therapy, such as tamoxifen or aromatase inhibitors, were excluded. We selected data for 196 patients with stage I to III breast cancer who were treated by radical or conservative surgery and received adjuvant chemotherapy at the Cancer Institute of the State of São Paulo, Brazil.
Before adjuvant chemotherapy, 67.8% of patients were classified as overweight or obese according to their body mass indices. Around 66.3% (95% CI 59.7–73.0) of the patients exhibited an increase in the body mass index after adjuvant chemotherapy. The average age of all patients was 56.3±11.3 years. Participants whose body mass index increased were younger than those with no increase (54.7±11.1 versus 59.3±11.2 years; p=0.007). Patients were treated with the following adjuvant chemotherapy regimens: doxorubicin, cyclophosphamide, and paclitaxel (AC-T, 129 patients, 65.8%); 5-fluoracil, doxorubicin, and cyclophosphamide (36 patients, 18.4%); cyclophosphamide, methotrexate, and 5-fluoracil (16 patients, 8.2%); docetaxel and cyclophosphamide (7 patients, 3.6%); and other regimen (8 patients, 4.1%). The AC-T regimen showed a statistically significant association with increase in the body mass index (p<0.001 by ANOVA).
Most patients with breast cancer showed an increase in the body mass index after adjuvant chemotherapy, especially after the AC-T chemotherapy regimen.