Summary
Revista Brasileira de Ginecologia e Obstetrícia. 2024;46:e-rbgo68
To evaluate the association between the dietary patterns (DPs) of pregnant women with GDM (gestational diabetes mellitus) and the birth weight (BW) of the infants.
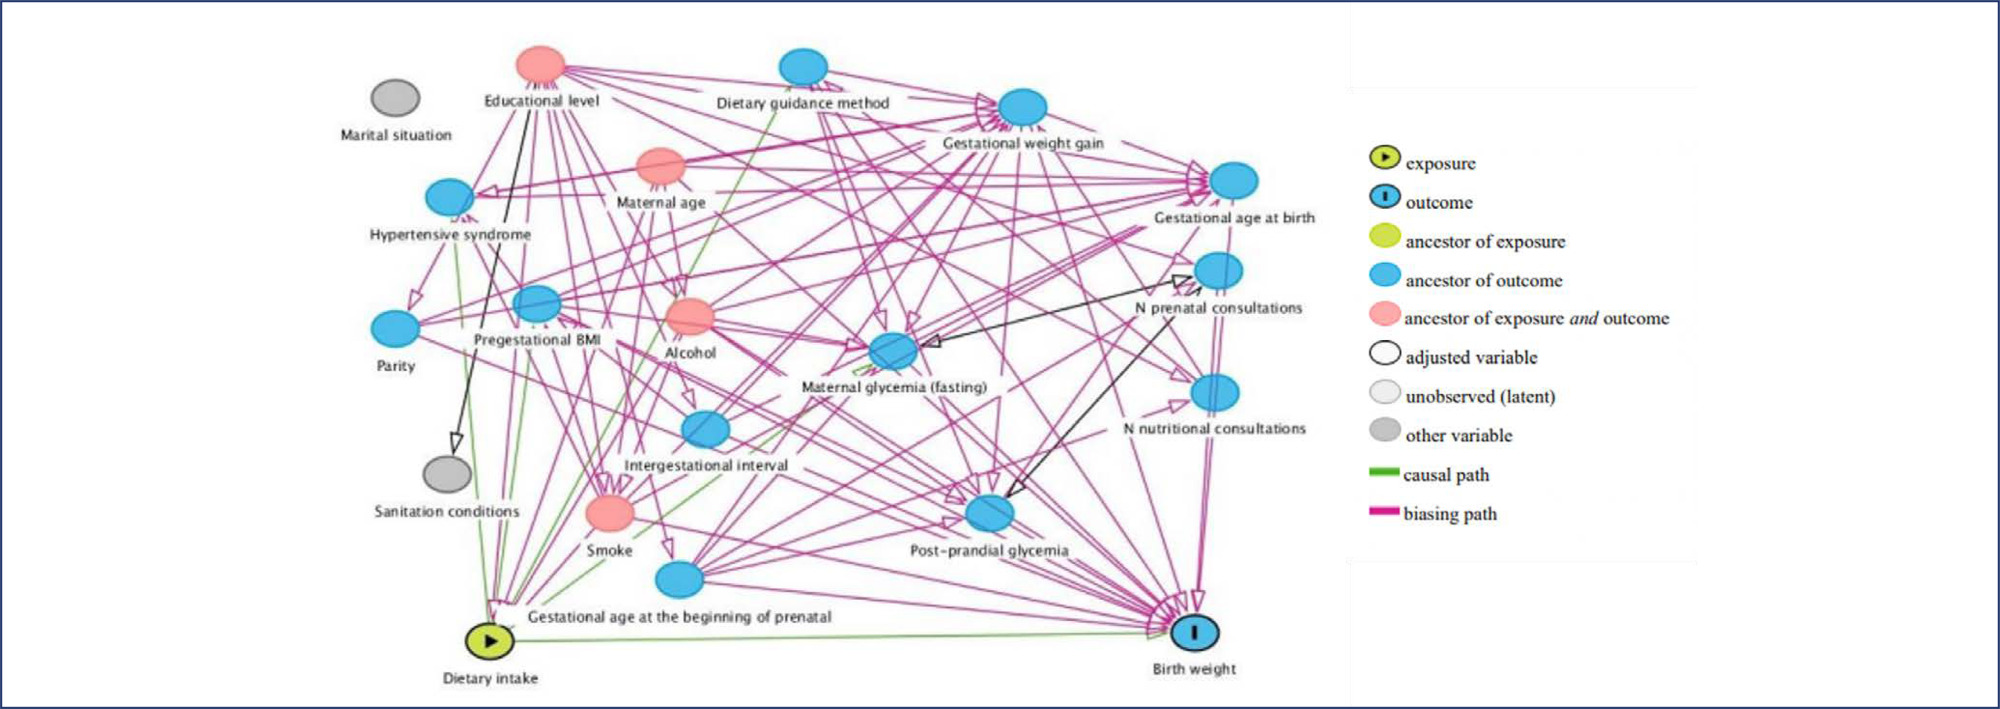
Cross-sectional study with 187 adult pregnant women with GDM attended at a maternity in Rio de Janeiro from 2011 to 2014. Dietary intake was assessed in the third trimester using a semiquantitative food frequency questionnaire (FFQ). The outcomes were BW and weight adequacy for gestational age (GA). Reduced Rank Regression (RRR) was used to explain the following response variables: density of carbohydrates, fibres, and saturated fatty acids. Statistical analyzes included multinomial logistic regression models.
The mean BW was 3261.9 (± 424.5) g. Three DPs were identified, with DP 3 (high consumption of refined carbohydrates, fast foods/snacks, whole milk, sugars/sweets, and soft drinks and low consumption of beans, vegetables, and low-fat milk and derivatives) being the main pattern, explaining 48.37% of the response variables. In the multinomial logistic regression analysis no statistically significant association was found between the tertiles of DPs and BW or the adequacy of weight for GA, even after adjustments of confounding covariates.
No significant associations were found between maternal DPs in the third trimester of pregnancy and infant BW or adequacy of weight for GA.
Summary
Revista Brasileira de Ginecologia e Obstetrícia. 2023;45(5):225-234
To evaluate the performance of Intergrowth-21 st (INT) and Fetal Medicine Foundation (FMF) curves in predicting perinatal and neurodevelopmental outcomes in newborns weighing below the 3rd percentile.
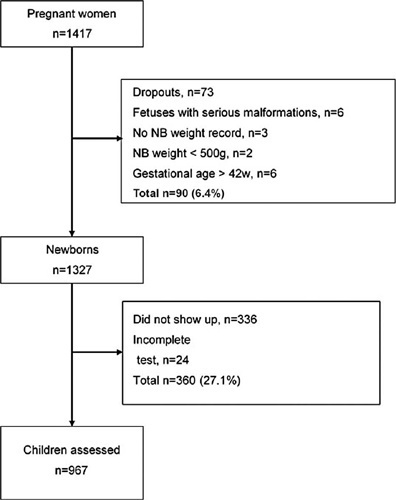
Pregnant women with a single fetus aged less than 20 weeks from a general population in non-hospital health units were included. Their children were evaluated at birth and in the second or third years of life. Newborns (NB) had their weight percentiles calculated for both curves. Sensitivity, specificity, positive (PPV) and negative predictive value (NPV), and area under the ROC curve (ROC-AUC) for perinatal outcomes and neurodevelopmental delay were calculated using birth weight < 3rd percentile as the cutoff.
A total of 967 children were evaluated. Gestational age at birth was 39.3 (± 3.6) weeks and birth weight was 3,215.0 (± 588.0) g. INT and FMF classified 19 (2.4%) and 49 (5.7%) newborns below the 3rd percentile, respectively. The prevalence of preterm birth, tracheal intubation >24 hours in the first three months of life, 5th minute Apgar <7, admission to a neonatal care unit (NICU admission), cesarean section rate, and the neurodevelopmental delay was 9.3%, 3.3%, 1.3%, 5.9%, 38.9%, and 7.3% respectively. In general, the 3rd percentile of both curves showed low sensitivity and PPV and high specificity and NPV. The 3rd percentile of FMF showed superior sensitivity for preterm birth, NICU admission, and cesarean section rate. INT was more specific for all outcomes and presented a higher PPV for the neurodevelopmental delay. However, except for a slight difference in the prediction of preterm birth in favor of INT, the ROC curves showed no differences in the prediction of perinatal and neurodevelopmental outcomes.
Birth weight below the 3rd percentile according to INT or FMF alone was insufficient for a good diagnostic performance of perinatal and neurodevelopmental outcomes. The analyzes performed could not show that one curve is better than the other in our population. INT may have an advantage in resource contingency scenarios as it discriminates fewer NB below the 3rd percentile without increasing adverse outcomes.
Summary
Revista Brasileira de Ginecologia e Obstetrícia. 2021;43(1):20-27
To analyze the agreement, in relation to the 90th percentile, of ultrasound measurements of abdominal circumference (AC) and estimated fetal weight (EFW), between the World Health Organization (WHO) and the International Fetal and Newborn Growth Consortium for the 21st Century (intergrowth-21st) tables, as well as regarding birth weight in fetuses/newborns of diabetic mothers.
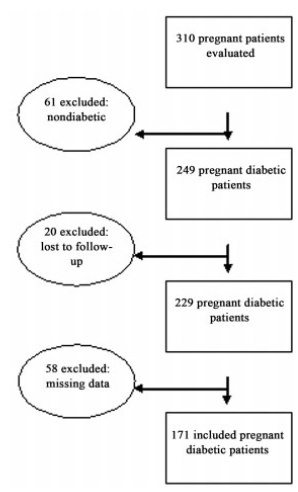
Retrospective study with data from medical records of 171 diabetic pregnant women, single pregnancies, followed between January 2017 and June 2018. Abdominal circumference and EFW data at admission (from 22 weeks) and predelivery (up to 3 weeks) were analyzed. These measures were classified in relation to the 90th percentile. The Kappa coefficient was used to analyze the agreement of these ultrasound variables between the WHO and intergrowth-21st tables, as well as, by reference table, these measurements and birth weight.
The WHO study reported 21.6% large-for-gestational-age (LGA) newborns while the intergrowth-21st reported 32.2%. Both tables had strong concordances in the assessment of initial AC, final AC, and initial EFW (Kappa = 0.66, 0.72 and 0.63, respectively) and almost perfect concordance in relation to final EFW (Kappa = 0.91). Regarding birth weight, the best concordances were found for initial AC (WHO: Kappa = 0.35; intergrowth-21st: Kappa= 0.42) and with the final EFW (WHO: Kappa = 0.33; intergrowth- 21st: Kappa = 0.35).
The initial AC and final EFW were the parameters of best agreement regarding birth weight classification. The WHO and intergrowth-21st tables showed high agreement in the classification of ultrasound measurements in relation to the 90th
Summary
Revista Brasileira de Ginecologia e Obstetrícia. 2018;40(10):580-586
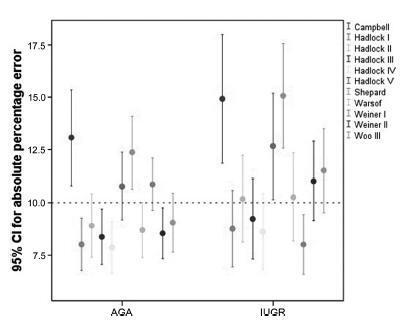
To assess 11 formulae commonly used to estimate fetal weight in a population of premature fetuses who had abnormal Doppler velocimetry due to early-onset placental insufficiency. The performance of each formula was evaluated in subgroups of fetuses with expected growth and intrauterine growth restriction.
Data were collected fromfetuses andmothers who delivered at three Brazilian hospitals between November 2002 and December 2013.We used the following formulae: Campbell; Hadlock I, II, III, IV and V; Shepard; Warsof; Weiner I and II; and Woo III.
We analyzed 194 fetuses. Of these, 116 (59.8%) were considered appropriate for gestational age (AGA), and 103 (53.1%) were male. The amniotic fluid volume was reduced in 87 (44.8%) fetuses, and the umbilical artery Doppler revealed absence or inversion of diastolic flow in 122 (62.9%) cases, and the analysis of the ductus venosus revealed abnormal flow in 60 (34.8%) fetuses. The Hadlock formulae using three or four fetal biometric parameters had low absolute percentage error in the estimated fetal weight among preterm fetuses with abnormal Doppler studies who were born within 5 days of the ultrasound evaluation. The results were not influenced by the clinical and ultrasound parameters often found in early-onset placental insufficiency.
In this study, the formulae with the best performance for fetal weight estimation in the analyzed population were Hadlock I and IV, which use four and three fetal biometric parameters respectively to estimate the weight of preterm fetuses with abnormal Doppler studies.
Summary
Revista Brasileira de Ginecologia e Obstetrícia. 2016;38(8):373-380
The placenta, translates how the fetus experiences the maternal environment and is a principal influence on birth weight (BW).
To explore the relationship between placental growth measures (PGMs) and BW in a public maternity hospital.
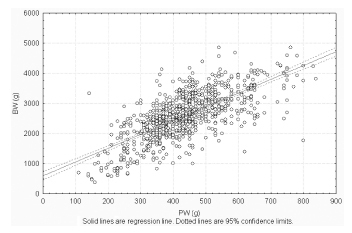
Observational retrospective study of 870 singleton live born infants at Hospital Maternidad Sardá, Universidad de Buenos Aires, Argentina, between January 2011 and August 2012 with complete data of PGMs. Details of history, clinical and obstetrical maternal data, labor and delivery and neonatal outcome data, including placental measures derived from the records, were evaluated. The following manual measurements of the placenta according to standard methods were performed: placental weight (PW, g), larger and smaller diameters (cm), eccentricity, width (cm), shape, area (cm2), BW/PW ratio (BPR) and PW/BW ratio (PBR), and efficiency. Associations between BW and PGMs were examined using multiple linear regression.
Birth weight was correlated with placental weight (R2 =0.49, p < 0.001), whereas gestational age was moderately correlated with placental weight (R2 =0.64, p < 0.001). By gestational age, there was a positive trend for PW and BPR, but an inverse relationship with PBR (p < 0.001). Placental weight alone accounted for 49% of birth weight variability (p < 0,001), whereas all PGMs accounted for 52% (p < 0,001). Combined, PGMs, maternal characteristics (parity, pre-eclampsia, tobacco use), gestational age and gender explained 77.8% of BW variations (p < 0,001). Among preterm births, 59% of BW variances were accounted for by PGMs, compared with 44% at term. All placental measures except BPR were consistently higher in females than in males, which was also not significant. Indices of placental efficiency showed weakly clinical relevance.
Reliable measures of placental growth estimate 53.6% of BW variances and project this outcome to a greater degree in preterm births than at term. These findings would contribute to the understanding of the maternal-placental programming of chronic diseases.
Summary
Revista Brasileira de Ginecologia e Obstetrícia. 2015;37(2):59-63
DOI 10.1590/SO100-720320140005180
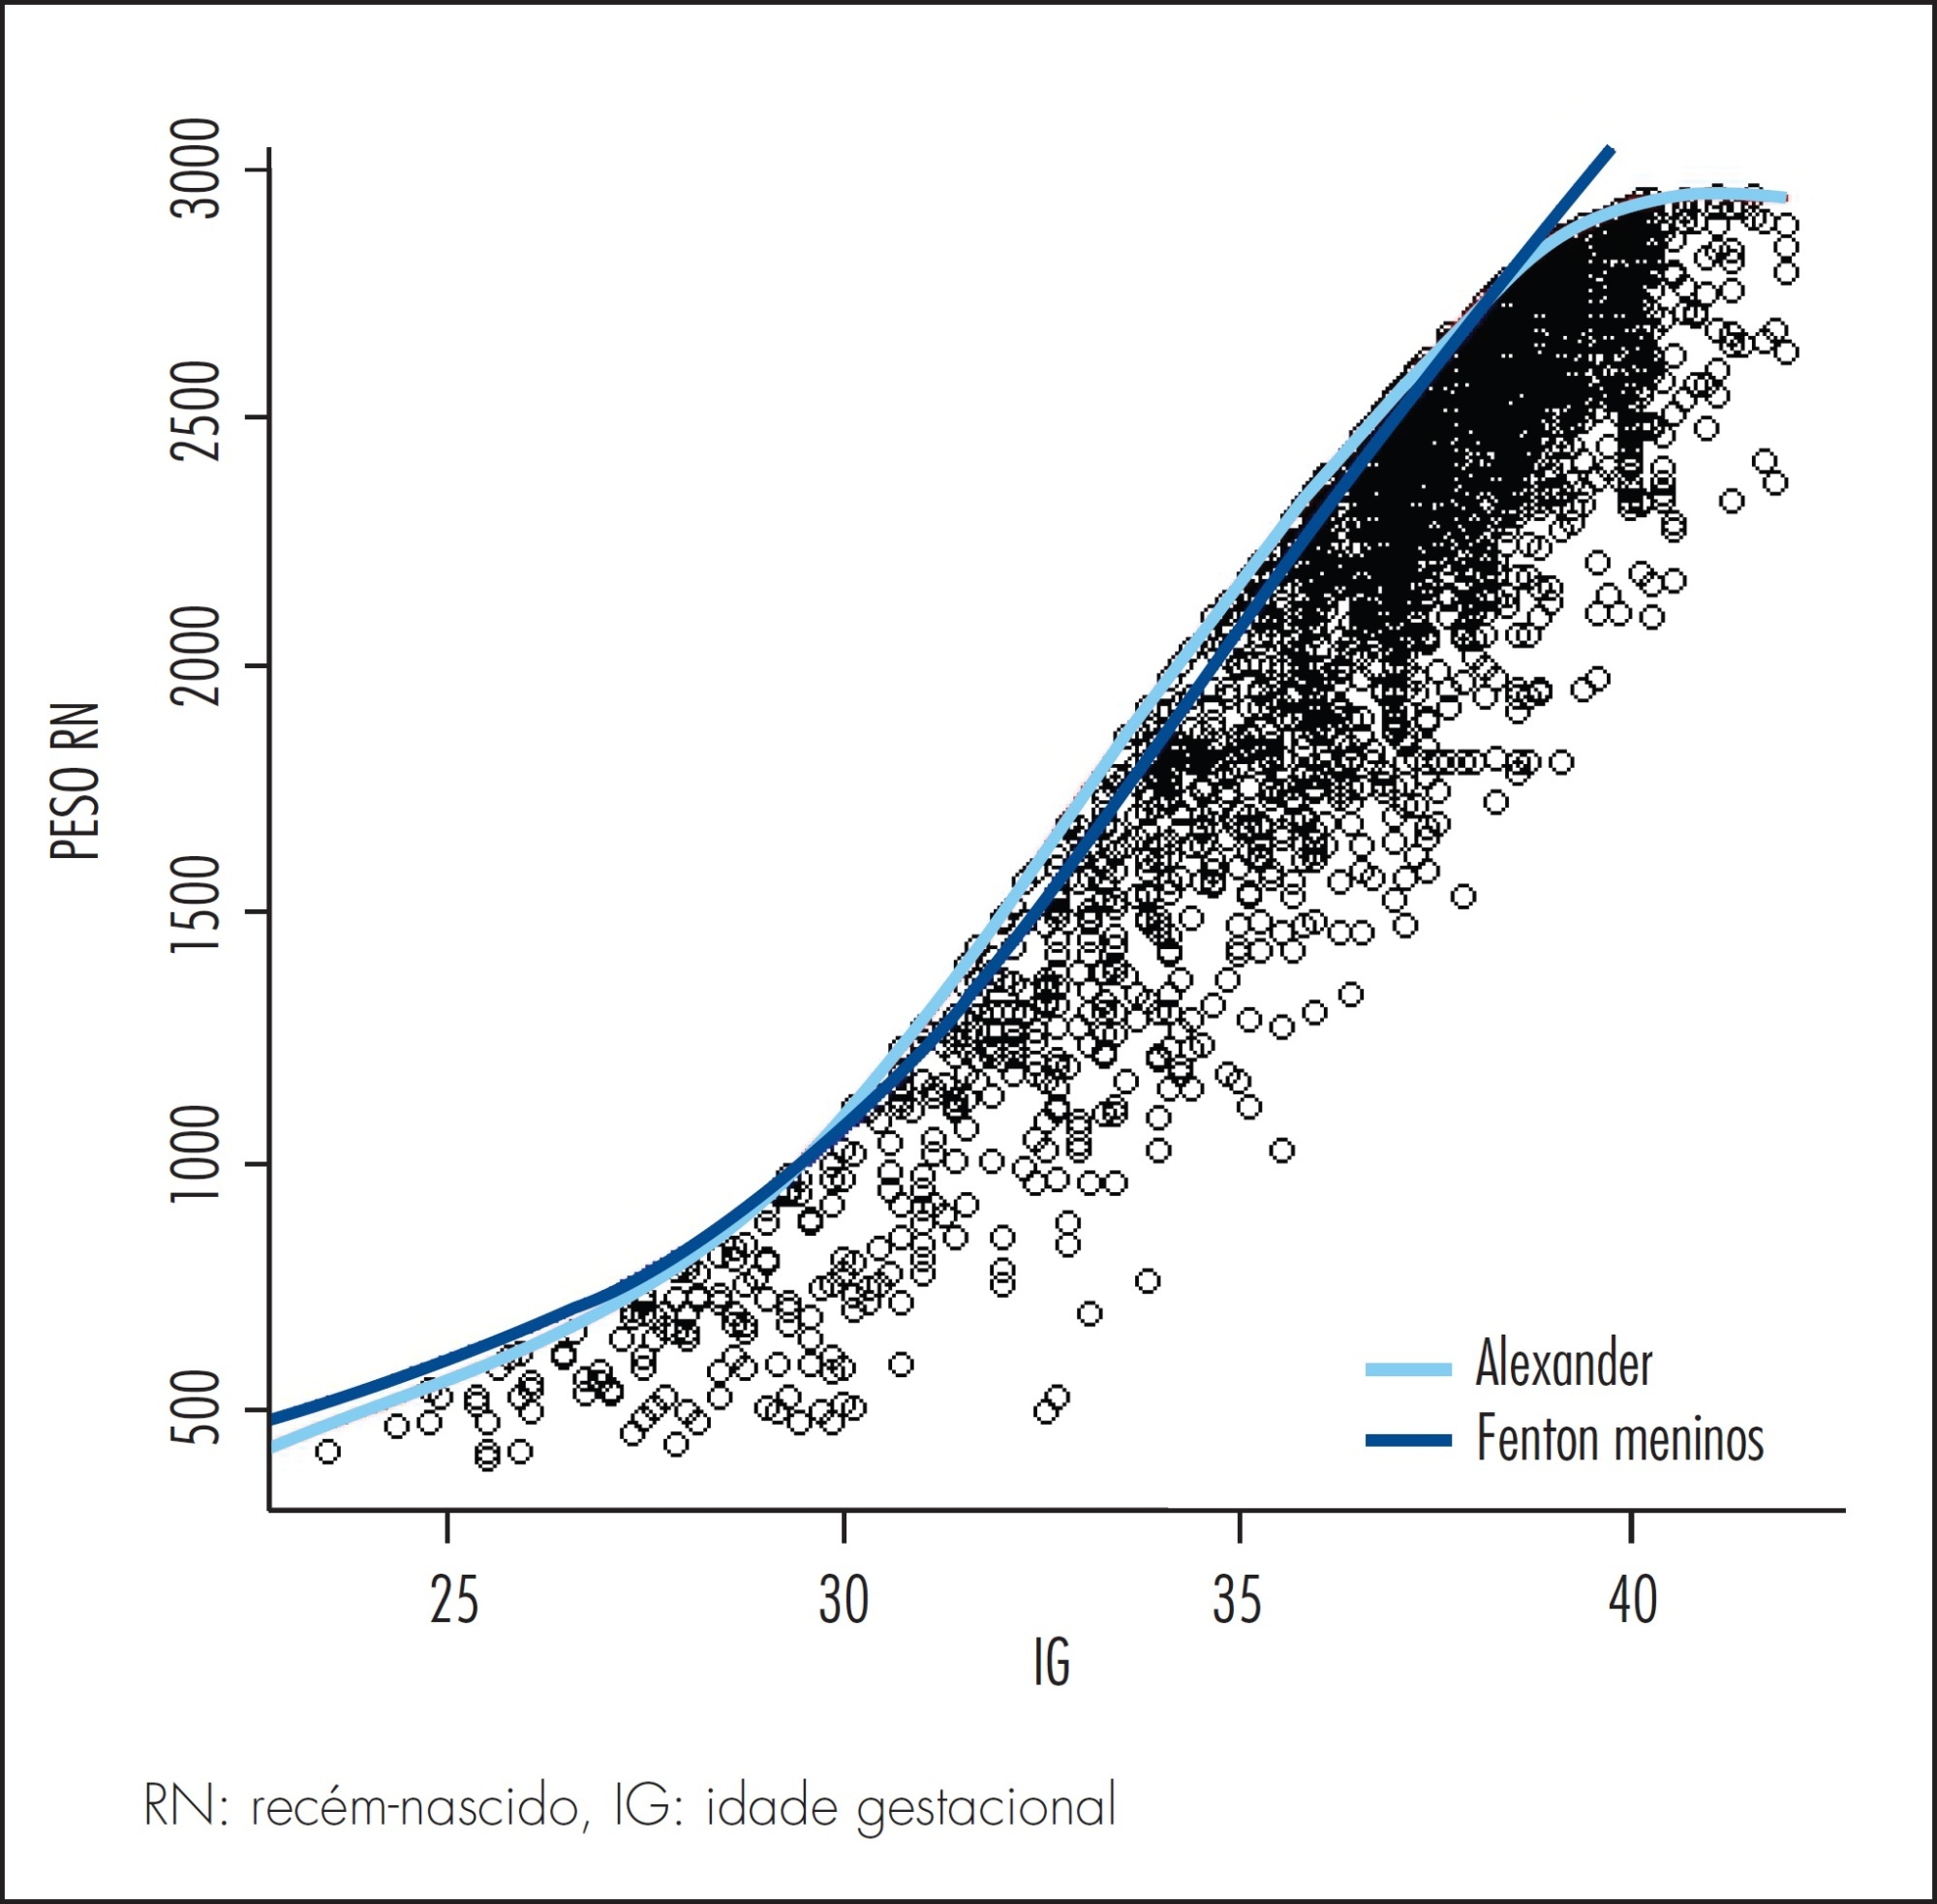
It was to compare the use of two growth curves for the diagnosis of small-for-gestational-age (SGA) infants, having the 10thpercentile as reference.
In a retrospective study, data of 20,567 singleton live births from January 2003 to June 2014 were analyzed, and divided according to gestational age: (a) 23 to 26, (b) 26 to 29, (c) 29 to 32, (d) 32 to 35, (e) 35 to 38, (f) 38 to 41 and (g) >41 weeks. Data were paired and analyzed using the McNemar test, with the level of significance set at 0.05.
The curve designed by Alexander indicated a higher percentage of diagnosis of SGA than the curve constructed by Fenton for every category of gestational age up to 41 weeks, more markedly in the 32-35 week group (18.5%). Between 37 and 40 weeks of gestational age, Alexander's curve exceeded Fenton's curve in 9.1% of the cases in the diagnosis of SGA.
The Fenton curve provides a more accurate evaluation of an infant's growth since it is gender-specific and allows measurement of three parameters. It has also been constructed with newer data and more sophisticated statistical tools.
Summary
Revista Brasileira de Ginecologia e Obstetrícia. 2013;35(8):349-356
DOI 10.1590/S0100-72032013000800003
PURPOSE: To characterize prenatal care and to evaluate the association of its adequacy with maternal, socioeconomic and environmental sanitation characteristics, as well as the influence of these factors on the birth weight of the children. METHODS: The eligible population for the study consisted of all women who had children during 2009 and lived in the city of Queimadas at the time of data collection. Information was collected with a questionnaire applied to the mothers in Family Health Basic Units or in their residence. The prenatal care adequacy index (outcome variable) was defined as adequate when the mother attended six or more prenatal visits and began monitoring during the first trimester of pregnancy (<20 weeks). Hierarchical logistic regression was performed to estimate the odds ratios for inadequate prenatal care and a multiple linear regression model was used to estimate the effect of adequacy of prenatal care and maternal, socioeconomic and environmental sanitation variables on birth weight. The statistical program used was Rv2.10.0, with the level of significance set at p <5%. RESULTS: Of a total of 199 women studied, 78.4% were classified as having received adequate prenatal care. After adjustment for other predictors, maternal age of 19 years or less remained as an explanatory variable of inadequate prenatal care (OR 4.27, 95%CI 1.10 - 15.89). Even after controlling for variables, child's birth weight was negatively associated with water supply from a well/spring and burnt/buried garbage, accounting for weight reductions of the order of 563.8, 262.0 and 951.9 g, respectively. CONCLUSION: Adequate prenatal care can alleviate the influence of socioeconomic disparities related to health care. Even in this situation, teenage mothers are more likely to receive inadequate prenatal care and low birth weight is favored by improper sanitation conditions (such as water supply and garbage disposal).
Summary
Revista Brasileira de Ginecologia e Obstetrícia. 2013;35(7):317-322
DOI 10.1590/S0100-72032013000700006
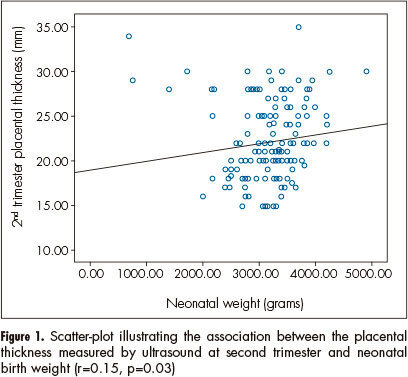
PURPOSE: To investigate relationship between placental thickness during the second and third trimesters and placental and birth weights. METHODS: From January 2011 to June 2012, a total of 250 singleton pregnant women presented at our antenatal clinic were enrolled in this prospective study. All recruited women were assessed at the 1st trimester screening for baseline demographic and obstetric data. The placental thickness was measured trans-abdominally by placing the ultrasound transducer perpendicularly to the plane of the placenta, in the area of the cord insertion at second and third trimester. Pearson's correlation analysis was used to establish the degree of relationship between placental thickness and birth and placental weights. RESULTS: Of 250 recruited participants, 205 women were able to complete the study. The mean age of cases was 26.4±5.1. Values of mean birth and placental weights were 305.56±657.0 and 551.7±104.8 grams respectively. Ultrasonographic measures of placental thickness in second and third trimester and changes between them were 21.68±4.52, 36.26±6.46 and 14.67±5.67 mm respectively. There was a significant positive correlation between placental thickness and birth weight in the second and third trimesters (r=0.15, p=0.03; r=0.14, p=0.04 correspondingly). CONCLUSION: According to our study, birth weight has a positive relation with both second and third trimester placental thickness; however, placental thickness change could not predict low birth weight.
