You searched for:"Edward Araujo Júnior"
We found (58) results for your search.Summary
Rev Bras Ginecol Obstet. 2010;32(9):426-432
DOI 10.1590/S0100-72032010000900003
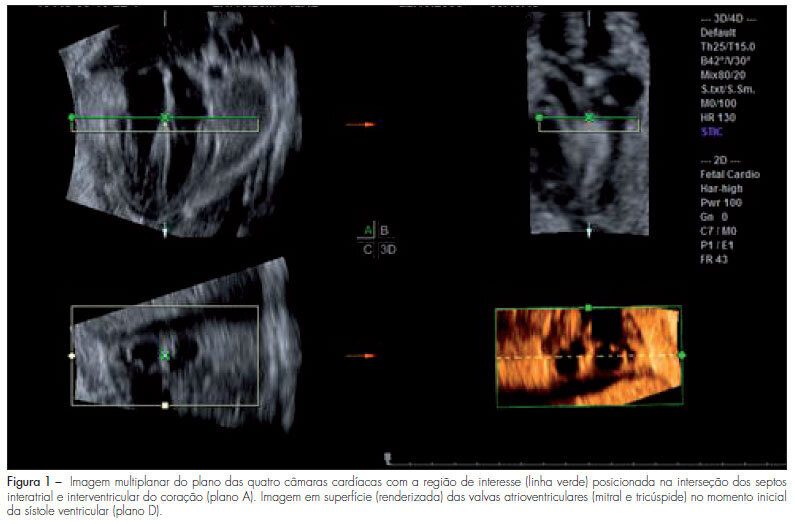
PURPOSE: to evaluate the areas of the atrioventricular valves (tricuspid and mitral) of normal fetuses by the use of three-dimensional ultrasound (3DUS) and the spatiotemporal image correlation (STIC) method. METHODS: a cross-sectional study was conducted on 141 women between the 18th and the 33rd week of pregnancy. Cardiac volumes were measured with a volumetric transabdominal transducer attached to the Voluson 730 Expert equipment. The four chamber plane was used as reference, with the region of interest (ROI) positioned from the ventricles, and the area of the valves was obtained manually. To determine the correlation of the areas with gestational age, scatter plots were constructed and the Pearson correlation coefficient (r) was calculated. Means, medians, standard deviations (SD) and maximum and minimum values were calculated. The simple linear regression model was used to determine reference ranges of valve areas according to the gestational age by the Altman method, with the level of significance set at p<0.05. To calculate the intraobserver reproducibility, we used the intraclass correlation coefficient (ICC) and the Bland-Altman graph. RESULTS: the mitral and tricuspid valve areas were correlated to the gestational age (r=0.80 for the tricuspid and r=0.79 for the mitral valve) and the mean value of the tricuspid and mitral valves increased from 0.22±0.10 cm² and 0.23±0.10 cm² on the 18th week to 0.92±0.29 cm² and 1.08±0.41 cm² on the 33rd of pregnancy, respectively. The intraobserver reproducibility resulted in an ICC=0.993 (95%CI 0.987; 0.996) and the mean difference was 0.01 cm² (SD±0.2 cm² and CI95%±0.4 cm²). CONCLUSION: reference intervals for the areas of the mitral and tricuspid valve between the 18th and the 33rd week of gestation were determined and proved to be highly reproducible.
Summary
Rev Bras Ginecol Obstet. 2010;32(9):426-432
DOI 10.1590/S0100-72032010000900003
PURPOSE: to evaluate the areas of the atrioventricular valves (tricuspid and mitral) of normal fetuses by the use of three-dimensional ultrasound (3DUS) and the spatiotemporal image correlation (STIC) method. METHODS: a cross-sectional study was conducted on 141 women between the 18th and the 33rd week of pregnancy. Cardiac volumes were measured with a volumetric transabdominal transducer attached to the Voluson 730 Expert equipment. The four chamber plane was used as reference, with the region of interest (ROI) positioned from the ventricles, and the area of the valves was obtained manually. To determine the correlation of the areas with gestational age, scatter plots were constructed and the Pearson correlation coefficient (r) was calculated. Means, medians, standard deviations (SD) and maximum and minimum values were calculated. The simple linear regression model was used to determine reference ranges of valve areas according to the gestational age by the Altman method, with the level of significance set at p<0.05. To calculate the intraobserver reproducibility, we used the intraclass correlation coefficient (ICC) and the Bland-Altman graph. RESULTS: the mitral and tricuspid valve areas were correlated to the gestational age (r=0.80 for the tricuspid and r=0.79 for the mitral valve) and the mean value of the tricuspid and mitral valves increased from 0.22±0.10 cm² and 0.23±0.10 cm² on the 18th week to 0.92±0.29 cm² and 1.08±0.41 cm² on the 33rd of pregnancy, respectively. The intraobserver reproducibility resulted in an ICC=0.993 (95%CI 0.987; 0.996) and the mean difference was 0.01 cm² (SD±0.2 cm² and CI95%±0.4 cm²). CONCLUSION: reference intervals for the areas of the mitral and tricuspid valve between the 18th and the 33rd week of gestation were determined and proved to be highly reproducible.
Summary
Rev Bras Ginecol Obstet. 2021;43(6):429-435
To evaluate serum levels of adiponectin in pregnant adolescents between 30 and 36 weeks of gestation.
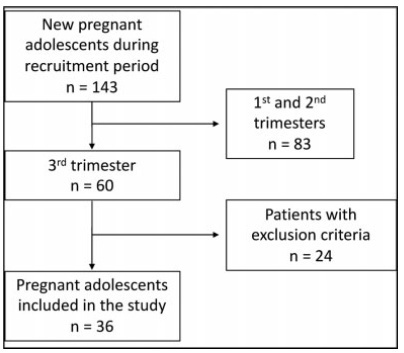
A prospective cross-sectional study enrolled 67 normal pregnant women between 30 and 36 weeks of gestation and eutrophic (body mass index [BMI]: 18.5-25 kg/m2), of which 36 were adolescents (< 20 years old) and 31 adults (≥ 20 years old). Serum adiponectin levels were determined by enzyme-linked immunosorbent assay (ELISA). The t-student or Mann-Whitney tests were used for intergroup comparison.
Pregnant adolescents showed significantly higher serum adiponectin concentrations comparedwith pregnant adults (p=0.04). No differences were observed in adiponectin levels in younger pregnant adolescents (< 16 years old) compared with older pregnant adolescents (≥ 16 years old). Adiponectin values were divided into 3 subgroups:<3,000 ng/mL, between 3,000 and 5,000 ng/mL, and>5,000 ng/mL. Birthweight was significantly higher in women>5,000 ng/mL when compared with<3,000 ng/mL in the adolescent group. No association between pregestational adiponectin levels and BMI, gestational weight gain, and gestational age was observed; however, there was a positive relation with birthweight (p=0.0239).
Serum adiponectin values in pregnant adolescents between 30 and 36 weeks of gestation were higher compared with pregnant adults; however, no differences between younger and older pregnant adolescents were observed.
Summary
Rev Bras Ginecol Obstet. 2021;43(6):429-435
To evaluate serum levels of adiponectin in pregnant adolescents between 30 and 36 weeks of gestation.
A prospective cross-sectional study enrolled 67 normal pregnant women between 30 and 36 weeks of gestation and eutrophic (body mass index [BMI]: 18.5-25 kg/m2), of which 36 were adolescents (< 20 years old) and 31 adults (≥ 20 years old). Serum adiponectin levels were determined by enzyme-linked immunosorbent assay (ELISA). The t-student or Mann-Whitney tests were used for intergroup comparison.
Pregnant adolescents showed significantly higher serum adiponectin concentrations comparedwith pregnant adults (p=0.04). No differences were observed in adiponectin levels in younger pregnant adolescents (< 16 years old) compared with older pregnant adolescents (≥ 16 years old). Adiponectin values were divided into 3 subgroups:<3,000 ng/mL, between 3,000 and 5,000 ng/mL, and>5,000 ng/mL. Birthweight was significantly higher in women>5,000 ng/mL when compared with<3,000 ng/mL in the adolescent group. No association between pregestational adiponectin levels and BMI, gestational weight gain, and gestational age was observed; however, there was a positive relation with birthweight (p=0.0239).
Serum adiponectin values in pregnant adolescents between 30 and 36 weeks of gestation were higher compared with pregnant adults; however, no differences between younger and older pregnant adolescents were observed.
Summary
Rev Bras Ginecol Obstet. 2016;38(9):436-442
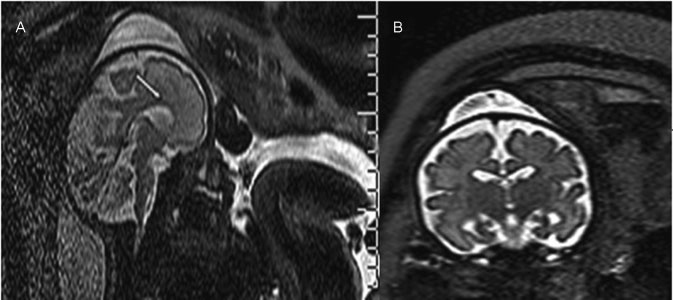
Ventriculomegaly (VM) is one the most frequent anomalies detected on prenatal ultrasound. Magnetic resonance imaging (MRI) may enhance diagnostic accuracy and prediction of developmental outcome in newborns.
The aim of this study was to assess the correlation between ultrasound and MRI in fetuses with isolated mild and moderate VM. The secondary aim was to report the neurodevelopmental outcome at 4 years of age.
Fetuses with a prenatal ultrasound (brain scan) diagnosis of VM were identified over a 4-year period. Ventriculomegaly was defined as an atrial width of 10- 15 mm that was further divided as mild (10.1-12.0 mm) and moderate (12.1-15.0 mm). Fetuses with VM underwent antenatal as well as postnatal follow-ups by brain scan and MRI. Neurodevelopmental outcome was performed using the Griffiths Mental Development Scales and conducted, where indicated, until 4 years into the postnatal period.
Sixty-two fetuses were identified. Ventriculomegaly was bilateral in 58% of cases. A stable dilatation was seen in 45% of cases, progression was seen in 13%, and regression of VM was seen in 4.5% respectively. Fetal MRI was performed in 54 fetuses and was concordant with brain scan findings in 85% of cases. Abnormal neurodevelopmental outcomes were seen in 9.6% of cases.
Fetuses in whom a progression of VM is seen are at a higher risk of developing an abnormal neurodevelopmental outcome. Although brain scan and MRI are substantially in agreement in defining the grade of ventricular dilatation, a low correlation was seen in the evaluation of VM associated with central nervous system (CNS) or non-CNS abnormalities.
Summary
Rev Bras Ginecol Obstet. 2016;38(9):436-442
Ventriculomegaly (VM) is one the most frequent anomalies detected on prenatal ultrasound. Magnetic resonance imaging (MRI) may enhance diagnostic accuracy and prediction of developmental outcome in newborns.
The aim of this study was to assess the correlation between ultrasound and MRI in fetuses with isolated mild and moderate VM. The secondary aim was to report the neurodevelopmental outcome at 4 years of age.
Fetuses with a prenatal ultrasound (brain scan) diagnosis of VM were identified over a 4-year period. Ventriculomegaly was defined as an atrial width of 10- 15 mm that was further divided as mild (10.1-12.0 mm) and moderate (12.1-15.0 mm). Fetuses with VM underwent antenatal as well as postnatal follow-ups by brain scan and MRI. Neurodevelopmental outcome was performed using the Griffiths Mental Development Scales and conducted, where indicated, until 4 years into the postnatal period.
Sixty-two fetuses were identified. Ventriculomegaly was bilateral in 58% of cases. A stable dilatation was seen in 45% of cases, progression was seen in 13%, and regression of VM was seen in 4.5% respectively. Fetal MRI was performed in 54 fetuses and was concordant with brain scan findings in 85% of cases. Abnormal neurodevelopmental outcomes were seen in 9.6% of cases.
Fetuses in whom a progression of VM is seen are at a higher risk of developing an abnormal neurodevelopmental outcome. Although brain scan and MRI are substantially in agreement in defining the grade of ventricular dilatation, a low correlation was seen in the evaluation of VM associated with central nervous system (CNS) or non-CNS abnormalities.
Summary
Rev Bras Ginecol Obstet. 2015;37(11):495-497
DOI 10.1590/SO100-720320150005473
Summary
Rev Bras Ginecol Obstet. 2015;37(11):495-497
DOI 10.1590/SO100-720320150005473
Summary
Rev Bras Ginecol Obstet. 2008;30(10):499-503
DOI 10.1590/S0100-72032008001000004
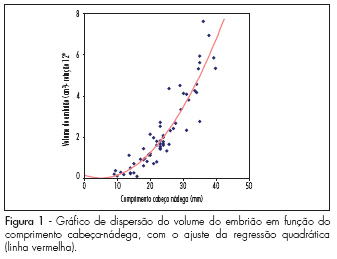
PURPOSE: to evaluate the embryo's volume (EV) between the seventh and the tenth gestational week, through tridimensional ultrasonography. METHODS: a transversal study with 63 normal pregnant women between the seventh and the tenth gestational week. The ultrasonographical exams have been performed with a volumetric abdominal transducer. Virtual Organ Computer-aided Analysis (VOCAL) has been used to calculate EV, with a rotation angle of 12º and a delimitation of 15 sequential slides. The average, median, standard deviation and maximum and minimum values have been calculated for the EV in all the gestational ages. A dispersion graphic has been drawn to assess the correlation between EV and the craniogluteal length (CGL), the adjustment being done by the determination coefficient (R²). To determine EV's reference intervals as a function of the CGL, the following formula was used: percentile=EV+K versus SD, with K=1.96. RESULTS: CGL has varied from 9.0 to 39.7 mm, with an average of 23.9 mm (±7.9 mm), while EV has varied from 0.1 to 7.6 cm³, with an average of 2.7 cm³ (±3.2 cm³). EV was highly correlated to CGL, the best adjustment being obtained with quadratic regression (EV=0.2-0.055 versus CGL+0.005 versus CGL²; R²=0.8). The average EV has varied from 0.1 (-0.3 to 0.5 cm³) to 6.7 cm³ (3.8 to 9.7 cm³) within the interval of 9 to 40 mm of CGL. EV has increased 67 times in this interval, while CGL, only 4.4 times. CONCLUSIONS: EV is a more sensitive parameter than CGL to evaluate embryo growth between the seventh and the tenth week of gestation.
Summary
Rev Bras Ginecol Obstet. 2008;30(10):499-503
DOI 10.1590/S0100-72032008001000004
PURPOSE: to evaluate the embryo's volume (EV) between the seventh and the tenth gestational week, through tridimensional ultrasonography. METHODS: a transversal study with 63 normal pregnant women between the seventh and the tenth gestational week. The ultrasonographical exams have been performed with a volumetric abdominal transducer. Virtual Organ Computer-aided Analysis (VOCAL) has been used to calculate EV, with a rotation angle of 12º and a delimitation of 15 sequential slides. The average, median, standard deviation and maximum and minimum values have been calculated for the EV in all the gestational ages. A dispersion graphic has been drawn to assess the correlation between EV and the craniogluteal length (CGL), the adjustment being done by the determination coefficient (R²). To determine EV's reference intervals as a function of the CGL, the following formula was used: percentile=EV+K versus SD, with K=1.96. RESULTS: CGL has varied from 9.0 to 39.7 mm, with an average of 23.9 mm (±7.9 mm), while EV has varied from 0.1 to 7.6 cm³, with an average of 2.7 cm³ (±3.2 cm³). EV was highly correlated to CGL, the best adjustment being obtained with quadratic regression (EV=0.2-0.055 versus CGL+0.005 versus CGL²; R²=0.8). The average EV has varied from 0.1 (-0.3 to 0.5 cm³) to 6.7 cm³ (3.8 to 9.7 cm³) within the interval of 9 to 40 mm of CGL. EV has increased 67 times in this interval, while CGL, only 4.4 times. CONCLUSIONS: EV is a more sensitive parameter than CGL to evaluate embryo growth between the seventh and the tenth week of gestation.
Summary
Rev Bras Ginecol Obstet. 2017;39(10):523-528
To assess cases of labor induction with vaginal 25-μg tablets of misoprostol and maternal outcomes in a tertiary hospital in southeastern Brazil.
This was a retrospective cohort study of 412 pregnant women with indication for labor induction. Labor induction was performed with vaginal 25-μg tablets ofmisoprostol in pregnant women with Bishop scores < 6. Stepwise regression analysis was used to identify the factors present at the beginning of induction that could be used as predictors of successful labor induction.
A total of 69% of the pregnant women who underwent labor induction progressed to vaginal delivery, and 31% of the women progressed to cesarean section. One or two misoprostol tablets were used in 244 patients (59.2%). Of the 412 patients, 197 (47.8%) required oxytocin later on in the labor process, after induction with misoprostol. The stepwise regression analysis showed that only Bishop scores of 4 and 5 and previous vaginal delivery were independent factors with statistical significance in the prediction of successful vaginal labor induction (β = 0.23, p < 0.001, for a Bishop score of 4 and 5, and β = 0.22, p < 0.001, for previous vaginal delivery).
Higher Bishop scores and previous vaginal delivery were the best predictors of successful labor induction with vaginal 25-μg tablets of misoprostol.
Summary
Rev Bras Ginecol Obstet. 2017;39(2):53-59
To evaluate blood loss during misoprostol-induced vaginal births and during cesarean sections after attempted misoprostol induction.
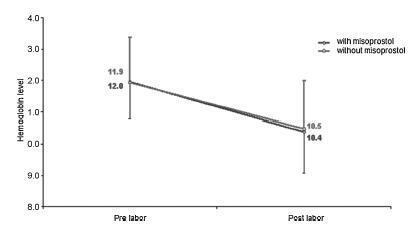
We conducted a prospective observational study in 101 pregnant women indicated for labor induction; pre- and postpartum hemoglobin levels were measured to estimate blood loss during delivery. Labor was induced by administering 25 μg vaginal misoprostol every 6 hours (with a maximum of 6 doses). The control group included 30 patients who spontaneously entered labor, and 30 patients who underwent elective cesarean section. Pre- and postpartum hemoglobin levels were evaluated using the analysis of variance for repeated measurements, showing the effects of time (pre- and postpartum) and of the group (with and withoutmisoprostol administration).
Therewere significant differences between pre- and postpartum hemoglobin levels (p < 0.0001) with regard to misoprostol-induced vaginal deliveries (1.6 ± 1.4 mg/dL), non-induced vaginal deliveries (1.4 ± 1.0 mg/dL), cesarean sections after attempted misoprostol induction (1.5 ± 1.0 mg/dL), and elective cesarean deliveries (1.8 ± 1.1 mg/dL). However, the differences were proportional between the groups with and without misoprostol administration, for both cesarean (p = 0.6845) and vaginal deliveries (p = 0.2694).
Labor induction using misoprostol did not affect blood loss during delivery.
Summary
Rev Bras Ginecol Obstet. 2017;39(2):53-59
To evaluate blood loss during misoprostol-induced vaginal births and during cesarean sections after attempted misoprostol induction.
We conducted a prospective observational study in 101 pregnant women indicated for labor induction; pre- and postpartum hemoglobin levels were measured to estimate blood loss during delivery. Labor was induced by administering 25 μg vaginal misoprostol every 6 hours (with a maximum of 6 doses). The control group included 30 patients who spontaneously entered labor, and 30 patients who underwent elective cesarean section. Pre- and postpartum hemoglobin levels were evaluated using the analysis of variance for repeated measurements, showing the effects of time (pre- and postpartum) and of the group (with and withoutmisoprostol administration).
Therewere significant differences between pre- and postpartum hemoglobin levels (p < 0.0001) with regard to misoprostol-induced vaginal deliveries (1.6 ± 1.4 mg/dL), non-induced vaginal deliveries (1.4 ± 1.0 mg/dL), cesarean sections after attempted misoprostol induction (1.5 ± 1.0 mg/dL), and elective cesarean deliveries (1.8 ± 1.1 mg/dL). However, the differences were proportional between the groups with and without misoprostol administration, for both cesarean (p = 0.6845) and vaginal deliveries (p = 0.2694).
Labor induction using misoprostol did not affect blood loss during delivery.
Summary
Rev Bras Ginecol Obstet. 2010;32(12):573-578
DOI 10.1590/S0100-72032010001200002
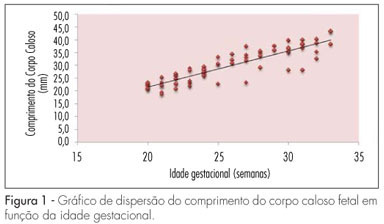
PURPOSE: to establish reference values for the length and area of the fetal corpus callosum between the 20th and 33rd weeks of gestation using three-dimensional ultrasound (3DUS). METHODS: this cross-sectional study involved 70 normal pregnancies with gestational age between 20 and 33 weeks. An Accuvix XQ instrument with a convex volumetric transducer (3 to 5 MHz) was used. To assess the corpus callosum, a transfrontal plane was obtained using the metopic suture as an acoustic window. Length was obtained by measuring the distance between the proximal and distal extremities of the corpus callosum. Area was obtained by manual tracing of the external corpus callosum surface. The means, medians, standard deviations, and maximum and minimum values were calculated for the corpus callosum length and area. Scatter graphs were created to analyze the correlation between corpus callosum length and area and gestational age and biparietal diameter, the quality adjustments was verified according to the determination coefficient (R²). The intraclass correlation coefficient (ICC) was used to assess the intraobserver variability. RESULTS: mean corpus callosum length increased from 21.7 (18.6 - 25.2 mm) to 38.7 mm (32.6 - 43.3 mm) between 20 and 33 weeks of pregnancy, respectively. Mean corpus callosum area increased from 55.2 (41.0 - 80.0 mm²) to 142.2 mm² (114.0 - 160.0 mm²), between 20 to 33 weeks of pregnancy, respectively. There was a strong correlation between corpus callosum length and area and gestational age (R² = 0.7 and 0.7, respectively) and biparietal diameter (R² = 0.7 and 0.6, respectively). Intraobserver variability was appropriate, with an ICC of 0.9 and 0.9 for length and area, respectively. CONCLUSIONS: reference values for corpus callosum length and area were established for fetuses between 20 and 33 weeks gestation. Intraobserver variability was appropriate.
Summary
Rev Bras Ginecol Obstet. 2010;32(12):573-578
DOI 10.1590/S0100-72032010001200002
PURPOSE: to establish reference values for the length and area of the fetal corpus callosum between the 20th and 33rd weeks of gestation using three-dimensional ultrasound (3DUS). METHODS: this cross-sectional study involved 70 normal pregnancies with gestational age between 20 and 33 weeks. An Accuvix XQ instrument with a convex volumetric transducer (3 to 5 MHz) was used. To assess the corpus callosum, a transfrontal plane was obtained using the metopic suture as an acoustic window. Length was obtained by measuring the distance between the proximal and distal extremities of the corpus callosum. Area was obtained by manual tracing of the external corpus callosum surface. The means, medians, standard deviations, and maximum and minimum values were calculated for the corpus callosum length and area. Scatter graphs were created to analyze the correlation between corpus callosum length and area and gestational age and biparietal diameter, the quality adjustments was verified according to the determination coefficient (R²). The intraclass correlation coefficient (ICC) was used to assess the intraobserver variability. RESULTS: mean corpus callosum length increased from 21.7 (18.6 - 25.2 mm) to 38.7 mm (32.6 - 43.3 mm) between 20 and 33 weeks of pregnancy, respectively. Mean corpus callosum area increased from 55.2 (41.0 - 80.0 mm²) to 142.2 mm² (114.0 - 160.0 mm²), between 20 to 33 weeks of pregnancy, respectively. There was a strong correlation between corpus callosum length and area and gestational age (R² = 0.7 and 0.7, respectively) and biparietal diameter (R² = 0.7 and 0.6, respectively). Intraobserver variability was appropriate, with an ICC of 0.9 and 0.9 for length and area, respectively. CONCLUSIONS: reference values for corpus callosum length and area were established for fetuses between 20 and 33 weeks gestation. Intraobserver variability was appropriate.